|
|
Read more here
|
|
Read more here
News Release from Greater Vancouver Realtors
FOR IMMEDIATE RELEASE:
Diverging trends widen as detached housing gains steam
VANCOUVER, BC – May 4, 2026 – Home sales registered on the MLS® in Metro Vancouver* remain relatively flat compared to April last year, but a divergence is emerging between market segments.
The Greater Vancouver REALTORS® (GVR) reports that residential sales in the region totalled 2,110 in April 2026, a 2.5 per cent decrease from the 2,163 sales recorded in April 2025. This was 22.9 per cent below the 10-year seasonal average (2,735).
“Last month we noted that a divergence was emerging between sales trends in the detached and multi-family segments, which continued in April,” said Andrew Lis, GVR chief economist and vice-president data analytics. “Sales of detached homes have been gaining year-over- year, while sales in the multi-family segment have declined, and this pattern is consistent across most areas. The fact this pattern is so broad-based reduces the likelihood what we’re seeing is just a blip in the data since the momentum isn’t isolated to small pockets of the market.”
There were 6,684 detached, attached and apartment properties newly listed for sale on the Multiple Listing Service® (MLS®) in Metro Vancouver in April 2026. This represents a 2.4 per cent decrease compared to the 6,850 properties listed in April 2025. This was 15.5 per cent above the 10-year seasonal average (5,785).
The total number of properties currently listed for sale on the MLS® system in Metro Vancouver is 16,236, a 0.2 per cent increase compared to April 2025 (16,207). This is 37.9 per cent above the 10-year seasonal average (11,773).
Across all detached, attached and apartment property types, the sales-to-active listings ratio for April 2026 is 13.5 per cent. By property type, the ratio is 11.3 per cent for detached homes, 15 per cent for attached, and 14.7 per cent for apartments.
Analysis of the historical data suggests downward pressure on home prices occurs when the ratio dips below 12 per cent for a sustained period, while home prices often experience upward pressure when it surpasses 20 per cent over several months.
“While it’s not always the case, there have been periods where the detached segment has acted as a bellwether of market sentiment, and it’s a question whether this time around this might be the case,” Lis said. “Prices across all segments remain relatively flat month over month as inventory levels remain sufficient to keep price escalation at bay. But with the detached segment picking up steam heading into the full swing of spring, it may only be a matter of time until the multi-family segments follow suit, which would slowly draw down standing inventory levels unless a surge of sellers come to market with their properties. We’ll be watching the next few months of data closely to see if pent-up demand re-enters the market heading into summer.”
The MLS® Home Price Index composite benchmark price for all residential properties in Metro Vancouver is currently $1,098,000. This represents a 6.9 per cent decrease over April 2025 and a 0.6 per cent decrease compared to March 2026.
Sales of detached homes in April 2026 reached 659, a 14 per cent increase from the 578 detached sales recorded in April 2025. The benchmark price for a detached home is $1,840,700. This represents an 8.3 per cent decrease from April 2025 and a 0.8 per cent decrease compared to March 2026.
Sales of apartment homes reached 1,009 in April 2026, a 10.7 per cent decrease compared to the 1,130 sales in April 2025. The benchmark price of an apartment home is $703,000. This represents a 7.9 per cent decrease from April 2025 and a 0.5 per cent decrease compared to March 2026.
Attached home sales in April 2026 totalled 433, a two per cent decrease compared to the 442 sales in April 2025. The benchmark price of a townhouse is $1,043,400. This represents a 5.1 per cent decrease from April 2025 and a 0.4 per cent decrease compared to March 2026.
Editor’s Note:
*Areas covered by Greater Vancouver REALTORS® include: Bowen Island, Burnaby, Coquitlam, Maple Ridge, New Westminster, North Vancouver, Pitt Meadows, Port Coquitlam, Port Moody, Richmond, South Delta, Squamish, Sunshine Coast, Vancouver, West Vancouver, and Whistler.
Greater Vancouver REALTORS® is an association representing more than 15,000 REALTORS® and their companies. The association provides a variety of member services, including the Multiple Listing Service®. For more information on real estate, statistics, and buying or selling a home, contact a local REALTOR® or visit www.gvrealtors.ca.
Read more here
Buyers and sellers adopting a wait-and-see approach to housing market
VANCOUVER, BC – April 2, 2026 – Home sales registered on the MLS® in Metro Vancouver* continue evolving at a pace similar to last year, with the sales down roughly three per cent from last March.
The Greater Vancouver REALTORS® (GVR) reports that residential sales in the region totalled 2,032 in March 2026, a 2.8 per cent decrease from the 2,091 sales recorded in March 2025. This was 31.8 per cent below the 10-year seasonal average (2,981).
“Year-to-date, sales are tracking our forecast for the year closely, and the weakness in demand we continue to observe at the aggregate level is unsurprising,” said Andrew Lis, GVR chief economist and vice-president data analytics. “What’s interesting is that the aggregate total masks an emerging divergence among market segments. While the multifamily segment continues to see slower sales, the detached segment may be awakening with sales up, and new listings down from last year.”
There were 5,792 detached, attached and apartment properties newly listed for sale on the Multiple Listing Service® (MLS®) in Metro Vancouver in March 2026. This represents a 10.3 per cent decrease compared to the 6,455 properties listed in March 2025. This was 4.9 per cent above the 10-year seasonal average (5,521).
The total number of properties currently listed for sale on the MLS® system in Metro Vancouver is 14,774, a 1.6 per cent increase compared to March 2025 (14,546). This is 38 per cent above the 10-year seasonal average (10,704).
Across all detached, attached and apartment property types, the sales-to-active listings ratio for March 2026 is 14.2 per cent. By property type, the ratio is 11 per cent for detached homes, 17.2 per cent for attached, and 15.7 per cent for apartments.
Analysis of the historical data suggests downward pressure on home prices occurs when the ratio dips below 12 per cent for a sustained period, while home prices often experience upward pressure when it surpasses 20 per cent over several months.
“We continue to see fewer sellers stepping into the market than last year, which is keeping inventory levels relatively flat. Pairing this dynamic with sales remaining below long-term averages, we’re not seeing prices move significantly in either direction,” Lis said. “And while the political uncertainty over tariffs may have diminished relative to what we saw in early 2025, the conflict in the middle east is now putting upward pressure on bond yields and fixed mortgage rates.
“As a result, it’s reasonable to expect there may be a dampening effect on demand as we head into the spring market, absent a swift resolution to the conflict.”
The MLS® Home Price Index composite benchmark price for all residential properties in Metro Vancouver is currently $1,104,300. This represents a 6.8 per cent decrease over March 2025 and a 0.4 per cent increase compared to February 2026.
Sales of detached homes in March 2026 reached 571, an 8.3 per cent increase from the 527 detached sales recorded in March 2025. The benchmark price for a detached home is $1,854,800. This represents an 8.2 per cent decrease from March 2025 and a 1 per cent increase compared to February 2026.
Sales of apartment homes reached 999 in March 2026, a 7.8 per cent decrease compared to the 1,084 sales in March 2025. The benchmark price of an apartment home is $706,700. This represents a 7.8 per cent decrease from March 2025 and a 0.2 per cent decrease compared to February 2026.
Attached home sales in March 2026 totalled 446, a 5.5 per cent decrease compared to the 472 sales in March 2025. The benchmark price of a townhouse is $1,047,100. This represents a 5.7 per cent decrease from March 2025 and a 0.1 per cent increase compared to February 2026.
Read more here
News Release
FOR IMMEDIATE RELEASE:
New normal for Metro Vancouver’s housing market continues
VANCOUVER, BC – March 3, 2026 – Metro Vancouver* home sales registered on the MLS® in February continued the recent trend of slower-than-average sales, seeing a ten per cent decline over the same period last year.
The Greater Vancouver REALTORS® (GVR) reports that residential sales in the region totalled 1,648 in February 2026, a 9.8 per cent decrease from the 1,827 sales recorded in February 2025. This was 28.7 per cent below the 10-year seasonal average (2,310).
“With each passing data point, the pace of sales running well-below long-term averages are no longer a surprise – it’s become the new norm,” said Andrew Lis, GVR chief economist and vice-president data analytics. “A surprising finding this February, however, is that home sellers appear less eager to list their homes relative to last year with new listings down about seven percent, mostly driven by fewer listings in the apartment segment.”
There were 4,734 detached, attached and apartment properties newly listed for sale on the Multiple Listing Service® (MLS®) in Metro Vancouver in February 2026. This represents a 6.4 per cent decrease compared to the 5,057 properties listed in February 2025. This was 7.1 per cent above the 10-year seasonal average (4,421).
The total number of properties currently listed for sale on the MLS® system in Metro Vancouver is 13,545, a 6.3 per cent increase compared to February 2025 (12,744). This is 37 per cent above the 10-year seasonal average (9,886).
Across all detached, attached and apartment property types, the sales-to-active listings ratio for February 2026 is 12.6 per cent. By property type, the ratio is nine per cent for detached homes, 16.6 per cent for attached, and 14.1 per cent for apartments.
Analysis of the historical data suggests downward pressure on home prices occurs when the ratio dips below 12 per cent for a sustained period, while home prices often experience upward pressure when it surpasses 20 per cent over several months.
“With fewer sellers coming to market with their properties than last year, a pick-up in demand heading into the spring could result in a stagnation of standing inventory, which may support
prices around current levels,” Lis said. “With sales slightly outpacing our 2026 forecast year- to-date, the spring market will be the litmus test of whether we continue along this new normal, or if we see any significant surprises.”
The MLS® Home Price Index composite benchmark price for all residential properties in Metro Vancouver is currently $1,100,300. This represents a 6.8 per cent decrease over February 2025 and a 0.1 per cent decrease compared to January 2026.
Sales of detached homes in February 2026 reached 427, a 10.5 per cent decrease from the 477 detached sales recorded in February 2025. The benchmark price for a detached home is $1,835,900. This represents an 8.8 per cent decrease from February 2025 and a 0.8 per cent decrease compared to January 2026.
Sales of apartment homes reached 824 in February 2026, a 15.6 per cent decrease compared to the 976 sales in February 2025. The benchmark price of an apartment home is $708,200. This represents a 6.8 per cent decrease from February 2025 and a 0.5 per cent increase compared to January 2026.
Attached home sales in February 2026 totalled 387, a 7.8 per cent increase compared to the 359 sales in February 2025. The benchmark price of a townhouse is $1,046,100. This represents a 5.6 per cent decrease from February 2025 and a 0.3 per cent increase compared to January 2026.
Read more here
Editor’s Note:
*Areas covered by Greater Vancouver REALTORS® include: Bowen Island, Burnaby, Coquitlam, Maple Ridge, New Westminster, North Vancouver, Pitt Meadows, Port Coquitlam, Port Moody, Richmond, South Delta, Squamish, Sunshine Coast, Vancouver, West Vancouver, and Whistler.
Greater Vancouver REALTORS® is an association representing more than 15,000 REALTORS® and their companies. The association provides a variety of member services, including the Multiple Listing Service®. For more information on real estate, statistics, and buying or selling a home, contact a local REALTOR® or visit www.gvrealtors.ca.
2025 saw lowest annual sales total in over two decades
VANCOUVER, B.C. – January 5, 2026 – Home sales registered in the Multiple Listing Service® (MLS®) in Metro Vancouver* finished the year down 10 per cent, marking the lowest annual sales total in over twenty years.
The Greater Vancouver REALTORS® (GVR) reports that residential sales in the region totalled 23,800 in 2025, a 10.4 per cent decrease from the 26,561 sales recorded in 2024, and a 9.3 per cent decrease from the 26,249 sales in 2023.
Last year’s sales total was 24.7 per cent below the 10-year annual sales average (31,625).
“This year was one for the history books,” said Andrew Lis, GVR’s chief economist and vice- president, data analytics. “Although the sales total was the lowest in over two decades, Realtors were still busy listing properties. Sellers brought the highest total of listings to market on record since the mid-1990s, eclipsing the previous record high in 2008 by a little over 1,000 listings.”
Properties listed on the MLS® in Metro Vancouver totalled 65,335 in 2025. This represents an 8.2 per cent increase compared to the 60,388 properties listed in 2024. This was 28.4 per cent above the 50,893 properties listed in 2023.
The total number of properties listed last year was 13.1 per cent above the region’s 10-year total annual average of (57,782).
Currently, the total number of homes listed for sale on the MLS® system in Metro Vancouver is 12,550, a 14.6 per cent increase compared to December 2024 (10,948). This is 34.8 per cent above the 10-year seasonal average (9,308).
“The forecast we put out last January noted a foreseeable downside risk, which while prescient, unfortunately materialized in 2025,” said Lis. “Specifically, we noted that trade tensions with the USA could negatively impact sales and prices, and this downside risk came to pass. The upshot, however, is that the negative impact of these trade tensions appears to be easing, and consumer sentiment has improved modestly over the second half of the year.”
The MLS® Home Price Index composite benchmark price for all residential properties in Metro Vancouver is currently $1,114,800. This represents a 4.5 per cent decrease over December 2024 and a 0.8 per cent decrease compared to November 2025.
“With sales down and inventory remaining plentiful, prices eased across all property types since the start of 2025. Sales and prices weren’t the only metrics that came down, borrowing costs fell nearly one full percentage point,” said Lis. “With lower prices, lower borrowing costs, and plenty of inventory to choose from, homebuyers in 2026 are starting the year with favorable conditions. Whether these conditions translate into a market with stronger demand will be the million-dollar question – and we’ll be monitoring this story closely as it unfolds.”
December 2025 summary
Residential sales in the region totalled 1,537 in December 2025, a 12.9 per cent decrease from the 1,765 sales recorded in December 2024. This was 20.7 per cent below the 10-year seasonal average (1,937).
There were 1,849 detached, attached and apartment properties newly listed for sale on the MLS® in Metro Vancouver in December 2025. This represents a 10.3 per cent increase compared to the 1,676 properties listed in December 2024. This was 10.3 per cent above the 10-year seasonal average (1,677).
Across all detached, attached and apartment property types, the sales-to-active listings ratio for December 2025 is 12.7 per cent. By property type, the ratio is 9.3 per cent for detached homes, 14.6 per cent for attached, and 15.1 per cent for apartments.
Analysis of the historical data suggests downward pressure on home prices occurs when the ratio dips below 12 per cent for a sustained period, while home prices often experience upward pressure when it surpasses 20 per cent over several months.
Sales of detached homes in December 2025 reached 431, a 12.8 per cent decrease from the 494 detached sales recorded in December 2024. The benchmark price for a detached home is $1,879,800. This represents a 5.3 per cent decrease from December 2024 and a 1.1 per cent decrease compared to November 2025.
Sales of apartment homes reached 791 in December 2025, a 11.2 per cent decrease compared to the 891 sales in December 2024. The benchmark price of an apartment home is $710,000. This represents a 5.3 per cent decrease from December 2024 and a 0.6 per cent decrease compared to November 2025.
Attached home sales in December 2025 totalled 303, an 18.3 per cent decrease compared to the 371 sales in December 2024. The benchmark price of a townhouse is $1,056,600. This represents a five per cent decrease from December 2024 and a 0.8 per cent decrease compared to November 2025.
Editor’s Note:
*Areas covered by Greater Vancouver REALTORS® include: Bowen Island, Burnaby, Coquitlam, Maple Ridge, New Westminster, North Vancouver, Pitt Meadows, Port Coquitlam, Port Moody, Richmond, South Delta, Squamish, Sunshine Coast, Vancouver, West Vancouver, and Whistler.
Greater Vancouver REALTORS® is an association representing more than 15,000 REALTORS® and their companies. The association provides a variety of member services, including the Multiple Listing Service®. For more information on real estate, statistics, and buying or selling a home, contact a local REALTOR® or visit www.gvrealtors.ca.
Housing market sees little change as year-end nears
VANCOUVER, B.C. – December 2, 2025 – Metro Vancouver* home-sale trends observed in October continued in November, as sales registered on the MLS® remained lower than this time last year.
The Greater Vancouver REALTORS® (GVR) reports that residential sales in the region totalled 1,846 in November 2025, a 15.4 per cent decrease from the 2,181 sales recorded in November 2024. This was 20.6 per cent below the 10-year seasonal average (2,324).
“As the year draws to a close, the data continues telling a story of a market with many buyers patiently waiting and sellers adjusting to market conditions not seen in years,” said Andrew Lis, GVR’s chief economist and vice-president, data analytics. “Inventory remains healthy, providing buyers ample choice, which, by contrast, is pushing sellers to accept that pricing must reflect this new reality. Buyers and sellers are striking deals when their expectations are aligned and reflective of the current market – not the market of years ago.”
There were 3,674 detached, attached and apartment properties newly listed for sale on the Multiple Listing Service® (MLS®) in Metro Vancouver in November 2025. This represents a 1.4 per cent decrease compared to the 3,725 properties listed in November 2024. This was 3.1 per cent above the 10-year seasonal average (3,562).
The total number of properties currently listed for sale on the MLS® system in Metro Vancouver is 15,149, a 14.4 per cent increase compared to November 2024 (13,245). This is 36.3 per cent above the 10-year seasonal average (11,116).
Across all detached, attached and apartment property types, the sales-to-active listings ratio for November 2025 is 12.6 per cent. By property type, the ratio is 9.7 per cent for detached homes, 13.6 per cent for attached, and 14.8 per cent for apartments.
Analysis of the historical data suggests downward pressure on home prices occurs when the ratio dips below 12 per cent for a sustained period, while home prices often experience upward pressure when it surpasses 20 per cent over several months.
“As sales volumes remain subdued and inventory remains plentiful, properties are taking longer to sell, and pricing has continued to soften slightly across most market segments,” Lis
said. “With borrowing costs likely to remain steady into the new year, any uptick in demand will need to arise from a significant change in buyer sentiment. As December is typically among the quietest months of the year in terms of market activity, the prevailing trends suggest we should expect a quiet close to a year marked by considerable uncertainty.”
The MLS® Home Price Index composite benchmark price for all residential properties in Metro Vancouver is currently $1,123,700. This represents a 3.9 per cent decrease over November 2024 and a 0.3 per cent decrease compared to October 2025.
Sales of detached homes in November 2025 reached 541, a 13.6 per cent decrease from the 626 detached sales recorded in November 2024. The benchmark price for a detached home is $1,900,600. This represents a 4.3 per cent decrease from November 2024 and a 0.4 per cent decrease compared to October 2025.
Sales of apartment homes reached 945 in November 2025, a 13.2 per cent decrease compared to the 1,089 sales in November 2024. The benchmark price of an apartment home is $714,300. This represents a 5.2 per cent decrease from November 2024 and a 0.2 per cent decrease compared to October 2025.
Attached home sales in November 2025 totalled 350, a 22.4 per cent decrease compared to the 451 sales in November 2024. The benchmark price of a townhouse is $1,065,600. This represents a 4.4 per cent decrease from November 2024 and a 0.1 per cent increase compared to October 2025.
Read more here
Full Stats package click here
Slow sales and high inventory give buyers the edge in October
VANCOUVER, B.C. – November 4, 2025 – Home sales registered on the MLS® in Metro Vancouver* were 14 per cent lower than last October, as the trend of slower sales and building inventory creates favourable conditions for those looking to buy in the fall market.
The Greater Vancouver REALTORS® (GVR) reports that residential sales in the region totalled 2,255 in October 2025, a 14.3 per cent decrease from the 2,632 sales recorded in October 2024. This was 14.5 per cent below the 10-year seasonal average (2,638).
“October is typically the last month of the year where sales activity sees a seasonal uptick, but sales still fell short of last year’s figures and the ten-year seasonal average,” said Andrew Lis, GVR’s chief economist and vice-president of data analytics. “Even the fourth cut this year to the Bank of Canada’s policy rate this October wasn’t enough to entice more buyers back into the market.”
There were 5,438 detached, attached and apartment properties newly listed for sale on the Multiple Listing Service® (MLS®) in Metro Vancouver in October 2025. This represents a 0.3 per cent decrease compared to the 5,452 properties listed in October 2024. This was 16.3 per cent above the 10-year seasonal average (4,676).
The total number of properties currently listed for sale on the MLS® system in Metro Vancouver is 16,393, a 13.2 per cent increase compared to October 2024 (14,477). This total is 35.9 per cent above the 10-year seasonal average (12,063).
Across all detached, attached and apartment property types, the sales-to-active listings ratio for October 2025 is 14.2 per cent. By property type, the ratio is 11.3 per cent for detached homes, 17.6 per cent for attached, and 15.5 per cent for apartments.
Analysis of the historical data suggests downward pressure on home prices occurs when the ratio dips below 12 per cent for a sustained period, while home prices often experience upward pressure when it surpasses 20 per cent over several months.
“After peaking in June, inventory levels have edged lower, and prices have eased across all market segments as slower-than-usual sales activity meets the highest inventory levels seen
in many years,” Lis said. “With no further reductions to the Bank of Canada’s policy rate expected in 2025, market conditions appear as favourable for buyers as they’ve been all year.”
The MLS® Home Price Index composite benchmark price for all residential properties in Metro Vancouver is currently $1,132,500. This represents a 3.4 per cent decrease over October 2024 and a 0.8 per cent decrease compared to September 2025.
Sales of detached homes in October 2025 reached 693, a 4.3 per cent decrease from the 724 detached sales recorded in October 2024. The benchmark price for a detached home is $1,916,400. This represents a 4.3 per cent decrease from October 2024 and a 0.9 per cent decrease compared to September 2025.
Sales of apartment homes reached 1,071 in October 2025, a 23.1 per cent decrease compared to the 1,393 sales in October 2024. The benchmark price of an apartment home is $718,900. This represents a 5.1 per cent decrease from October 2024 and a 1.4 per cent decrease compared to September 2025.
Attached home sales in October 2025 totalled 477, a 4.8 per cent decrease compared to the 501 sales in October 2024. The benchmark price of a townhouse is $1,066,700.
This represents a 3.8 per cent decrease from October 2024 and a 0.3 per cent decrease compared to September 2025.
Read more here
The Buyers' Market Continues
News Release
FOR IMMEDIATE RELEASE:
Fall market favours buyers
VANCOUVER, B.C. – October 2, 2025 – Another Bank of Canada rate cut and easing prices helped home sales registered on the MLS® in Metro Vancouver* edge higher relative to September last year.
The Greater Vancouver REALTORS® (GVR) reports that residential sales in the region totalled 1,875 in September 2025, a 1.2 per cent increase from the 1,852 sales recorded in September 2024. This was 20.1 per cent below the 10-year seasonal average (2,348).
“With another cut to Bank of Canada’s policy rate behind us, and markets pricing in at least one more cut by the end of the year, Metro Vancouver homebuyers have reason to be optimistic about the fall market,” said Andrew Lis, GVR’s director of economics and data analytics. “Easing prices, near-record high inventory levels, and increasingly favourable borrowing costs are offering those looking to purchase a home this fall with plenty of opportunity.”
Read more here
From Great Vancouver Realtors:
Easing home prices help lift sales in August
VANCOUVER, B.C. – September 3, 2025 – Easing prices brought more Metro Vancouver* homebuyers off the sidelines in August, with home sales on the MLS® up nearly three per cent from August last year.
The Greater Vancouver REALTORS® (GVR) reports that residential sales in the region totalled 1,959 in August 2025, a 2.9 per cent increase from the 1,904 sales recorded in August 2024. This was 19.2 per cent below the 10-year seasonal average (2,424).
“The August sales figures add further confirmation that sales activity across Metro Vancouver appears to be recovering, albeit somewhat slowly, from the challenging first half of the year,” said Andrew Lis, GVR’s director of economics and data analytics. “Sales in the detached and attached segments are up over ten per cent from last August, which suggests buyers shopping in more expensive price points are re-entering the market in a meaningful way.”
There were 4,225 detached, attached and apartment properties newly listed for sale on the Multiple Listing Service® (MLS®) in Metro Vancouver in August 2025. This represents a 2.8 per cent increase compared to the 4,109 properties listed in August 2024. This was 1.3 per cent above the 10-year seasonal average (4,172).
The total number of properties currently listed for sale on the MLS® system in Metro Vancouver is 16,242, a 17.6 per cent increase compared to August 2024 (13,812). This is 36.9 per cent above the 10-year seasonal average (11,862).
Across all detached, attached and apartment property types, the sales-to-active listings ratio for August 2025 is 12.4 per cent. By property type, the ratio is 9.3 per cent for detached homes, 15.8 per cent for attached, and 14 per cent for apartments.
Analysis of the historical data suggests downward pressure on home prices occurs when the ratio dips below 12 per cent for a sustained period, while home prices often experience upward pressure when it surpasses 20 per cent over several months.
“Prices have eased around two per cent since the start of the year and are down about one per cent month over month in August, signalling that sellers have been willing to lower price expectations,” Lis said. “As sellers’ and buyers’ expectations have become more aligned, transaction volume has picked up. Newly listed properties remain in line with their ten-year seasonal average, however, when paired with increasing sales activity, is likely to diminish the available inventory. This also means the window of plentiful opportunity for buyers may soon begin closing if these trends continue.”
The MLS® Home Price Index composite benchmark price for all residential properties in Metro Vancouver is currently $1,150,400. This represents a 3.8 per cent decrease over August 2024 and a 1.3 per cent decrease compared to July 2025.
Sales of detached homes in August 2025 reached 575, a 13 per cent increase from the 509 detached sales recorded in August 2024. The benchmark price for a detached home is $1,950,300. This represents a 4.8 per cent decrease from August 2024 and a 1.2 per cent decrease compared to July 2025.
Sales of apartment homes reached 956 in August 2025, a 5.5 per cent decrease compared to the 1,012 sales in August 2024. The benchmark price of an apartment home is $734,400. This represents a 4.4 per cent decrease from August 2024 and a 1.3 per cent decrease compared to July 2025.
Attached home sales in August 2025 totalled 409, a 10.5 per cent increase compared to the 370 sales in August 2024. The benchmark price of a townhouse is $1,079,600. This represents a 3.5 per cent decrease from August 2024 and a 1.8 per cent decrease compared to July 2025.
Read more HERE
Stats Centre Reports - July 2025 from Greater Vancouver Realtors
The latest Stats Centre Report for Metro Vancouver is now available.
Read it here
Home sale trend stabilizing in June
VANCOUVER, BC – July 3, 2025 – After a turbulent first half of the year, home sales registered on the MLS® across Metro Vancouver* are showing emerging signs of a recovery, down ten per cent year-over-year – halving the decline seen last month.
The Greater Vancouver REALTORS® (GVR) reports that residential sales in the region totalled 2,181 in June 2025, a 9.8 per cent decrease from the 2,418 sales recorded in June 2024. This was 25.8 per cent below the 10-year seasonal average (2,940).
“On a trended basis, signs are emerging that sales activity is rounding the corner after a challenging first half to the year, with the year-over-year decline in sales in June halving the decline we saw in May,” said Andrew Lis, GVR’s director of economics and data analytics. “If this momentum continues, it may not be long before sales are up year-over-year, which would mark a shift toward a market with more demand than the unusually low demand we’ve seen so far this year.”
There were 6,315 detached, attached and apartment properties newly listed for sale on the Multiple Listing Service® (MLS®) in Metro Vancouver in June 2025. This represents a 10.3 per cent increase compared to the 5,723 properties listed in June 2024. This was 12.7 per cent above the 10-year seasonal average (5,604).
The total number of properties currently listed for sale on the MLS® system in Metro Vancouver is 17,561, a 23.8 per cent increase compared to June 2024 (14,182). This is 43.7 per cent above the 10-year seasonal average (12,223).
Across all detached, attached and apartment property types, the sales-to-active listings ratio for June 2025 is 12.8 per cent. By property type, the ratio is 9.9 per cent for detached homes, 16.9 per cent for attached, and 13.9 per cent for apartments.
Analysis of the historical data suggests downward pressure on home prices occurs when the ratio dips below 12 per cent for a sustained period, while home prices often experience upward pressure when it surpasses 20 per cent over several months.
“As home sales regain their footing, inventory levels aren’t building as quickly as we’ve seen lately,” Lis said. “Most market segments remain in balanced market conditions, which has
generally kept prices trending sideways since the start of the year. With over 17,000 listings on the market right now, and with mortgage rates down around two per cent since last summer, buyers are enjoying some of the most favorable conditions seen in years.”
The MLS® Home Price Index composite benchmark price for all residential properties in Metro Vancouver is currently $1,173,100. This represents a 2.8 per cent decrease over June 2024 and a 0.3 per cent decrease compared to May 2025.
Sales of detached homes in June 2025 reached 657, a 5.3 per cent decrease from the 694 detached sales recorded in June 2024. The benchmark price for a detached home is $1,994,500. This represents a 3.2 per cent decrease from June 2024 and a 0.1 per cent decrease compared to May 2025.
Sales of apartment homes reached 1,040 in June 2025, a 16.5 per cent decrease compared to the 1,245 sales in June 2024. The benchmark price of an apartment home is $748,400. This represents a 3.2 per cent decrease from June 2024 and a 1.2 per cent decrease compared to May 2025.
Attached home sales in June 2025 totalled 473, a 3.7 per cent increase compared to the 456 sales in June 2024. The benchmark price of a townhouse is $1,103,900. This represents a three per cent decrease from June 2024 and a 0.3 per cent decrease compared to May 2025.
Editor’s Note:
*Areas covered by Greater Vancouver REALTORS® include: Bowen Island, Burnaby, Coquitlam, Maple Ridge, New Westminster, North Vancouver, Pitt Meadows, Port Coquitlam, Port Moody, Richmond, South Delta, Squamish, Sunshine Coast, Vancouver, West Vancouver, and Whistler.
News Release
FOR IMMEDIATE RELEASE:
Buyers remain hesitant as inventory builds
VANCOUVER, BC – June 3, 2025 – May saw inventory levels across Metro Vancouver* reach another ten-year high, while home sales registered on the MLS® remained muted.
The Greater Vancouver REALTORS® (GVR) reports that residential sales in the region totalled 2,228 in May 2025, an 18.5 per cent decrease from the 2,733 sales recorded in May 2024. This was 30.5 per cent below the 10-year seasonal average (3,206).
“While there are emerging signs that sales activity might be turning a corner, sales in May were below the ten-year seasonal average, which suggests that some buyers are still sitting on the sidelines or are being especially selective,” said Andrew Lis, GVR’s director of economics and data analytics. “On a year-to-date basis, sales in 2025 rank among the slowest to start the year in the past decade, closely mirroring the trends seen in 2019 and 2020. It’s worth noting that sales rebounded significantly in the latter half of 2020, but whether sales in 2025 might follow a similar pattern remains the million-dollar question.
Read more here
From Greater Vancouver Realtors:
The spring market brings an abundance of opportunity for buyers
VANCOUVER, BC – May 2, 2025 – The slowdown in home sales registered on the Multiple
Listing Service® (MLS®) in Metro Vancouver* that began early this year continued in April,
with sales down nearly 24 per cent year-over-year.
The Greater Vancouver REALTORS® (GVR) reports that residential sales in the region totalled
2,163 in April 2025, a 23.6 per cent decrease from the 2,831 sales recorded in April 2024. This
was 28.2 per cent below the 10-year seasonal average (3,014).
“From a historical perspective, the slower sales we’re now seeing stand out as unusual,
particularly against a backdrop of significantly improved borrowing conditions, which
typically helps to boost sales,” said Andrew Lis, GVR’s director of economics and data
analytics. “What’s also unusual is starting the year with Canada’s largest trading partner
threatening to tilt our economy into recession via trade policy, while at the same time having
Canadians head to the polls to elect a new federal government. These issues have been hard
to ignore, and the April home sales figures suggest some buyers have continued to patiently
wait out the storm.”
READ MORE HERE
Home sales registered on the MLS® in the Metro Vancouver* for the month of March were the lowest going back to 2019 for the same month, while active listings continue their upward trend.
The Greater Vancouver REALTORS® (GVR) reports that residential sales in the region totalled 2,091 in March 2025, a 13.4 percent decrease from the 2,415 sales recorded in March 2024. This was 36.8 percent below the 10-year seasonal average (3,308).
There were 6,455 detached, attached and apartment properties newly listed for sale on the Multiple Listing Service® (MLS®) in Metro Vancouver in March 2025. This represents a 29 percent increase compared to the 5,002 properties listed in March 2024. This was 15.8 percent above the 10-year seasonal average (5,572).
The total number of properties currently listed for sale on the MLS® system in Metro Vancouver is 14,546, a 37.9 percent increase compared to March 2024 (10,552). This is 44.9 per cent above the 10-year seasonal average (10,038).
Across all detached, attached and apartment property types, the sales-to-active listings ratio for March 2025 is 14.9 per cent. By property type, the ratio is 10.3 percent for detached homes, 21.5 per cent for attached, and 16.2 per cent for apartments.
Analysis of the historical data suggests downward pressure on home prices occurs when the ratio dips below 12 percent for a sustained period, while home prices often experience upward pressure when it surpasses 20 per cent over several months.
“The current market bears resemblance to early 2023 where price trends were generally flat, and sales started the year off slowly before gaining momentum in the spring and summer months,” Lis said.
“While market conditions overall remain balanced, it’s worth noting that the attached segment continues teetering on the threshold of a sellers’ market as a result of a chronic undersupply, with only about 2,200 active listings available for prospective buyers throughout the entire region.”
The MLS® Home Price Index composite benchmark price for all residential properties in Metro Vancouver is currently $1,190,900. This represents a 0.6 per cent decrease over March 2024 and a 0.5 percent increase compared to February 2025.
Sales of detached homes in March 2025 reached 527, a 24.1 percent decrease from the 694 detached sales recorded in March 2024. The benchmark price for a detached home is $2,034,400. This represents a 0.8 percent increase from March 2024 and a 0.4 percent increase compared to February 2025.
Sales of apartment homes reached 1,084 in March 2025, a 10.2 percent decrease compared to the 1,207 sales in March 2024. The benchmark price of an apartment home is $767,300. This represents a 0.9 percent decrease from March 2024 and a 1 percent increase compared to February 2025.
Attached home sales in March 2025 totalled 472, a 4.6 percent decrease compared to the 495 sales in March 2024. The benchmark price of a townhouse is $1,113,100. This represents a 0.8 percent decrease from March 2024 and a 0.2 percent increase compared to February 2025.
* Areas covered by Greater Vancouver REALTORS® include: Bowen Island, Burnaby, Coquitlam, Maple Ridge, New Westminster, North Vancouver, Pitt Meadows, Port Coquitlam, Port Moody, Richmond, South Delta, Squamish, Sunshine Coast, Vancouver, West Vancouver, and Whistler.
From Great Vancouver Realtors:
VANCOUVER, BC – March 4, 2025 – After a 46 per cent year-over-year increase of new listings in January, the number of newly listed properties on the MLS® in Metro Vancouver* rose more moderately in February helping keep market conditions in balanced territory.
The Greater Vancouver REALTORS® (GVR) reports that residential sales in the region totalled 1,827 on Metro Vancouver’s Multiple Listing Service® (MLS®) in February 2025, an 11.7 per cent decrease from the 2,070 sales recorded in February 2024. This total was 28.9 per cent below the 10-year seasonal average (2,571).
“After the rush of new listings in January, home sales and new listings in February were closer to historical averages, which has positioned the overall market in balanced conditions,” Andrew Lis, GVR’s director of economics and data analytics said. “With a potential Bank of Canada rate cut on the table for mid-March, homebuyers may find slightly improved borrowing conditions while enjoying the largest selection of homes on the market since pre- pandemic times.”
Read more here
Homes newly listed on the MLS® in Metro Vancouver* rose 46 per cent year-over-year in January, as sellers appear eager to enter the market to start the year.
The Greater Vancouver REALTORS® (GVR) reports that residential sales in the region totalled 1,552 in January 2025, an 8.8 per cent increase from the 1,427 sales recorded in January 2024. This was 11.3 per cent below the 10-year seasonal average (1,749).
Read more here
News Release GVR
FOR IMMEDIATE RELEASE:
Home sales register a strong finish to cap off 2024
VANCOUVER, BC – January 3, 2025 – Home sales registered on the Multiple Listing Service®
(MLS®) in Metro Vancouver1 rose over thirty per cent in December, compared to the previous
year, signalling strengthening demand-side momentum to close out 2024.
The Greater Vancouver REALTORS® (GVR)2 reports that residential sales in the region
totalled 26,561 in 2024, a 1.2 per cent increase from the 26,249 sales recorded in 2023, and a
9.2 per cent decrease from the 29,261 sales in 2022.
Last year’s sales total was 20.9 per cent below the 10-year annual sales average (33,559).
“Looking back on 2024, it could best be described as a pivot year for the market after
experiencing such dramatic increases in mortgage rates in the preceding years,” said Andrew
Lis, GVR’s director of economics and data analytics. “With borrowing costs now firmly on the
decline, buyers have started to show up in numbers after somewhat of a hiatus – and this
renewed strength is now clearly visible in the more recent monthly data.”
Properties listed on the MLS® system in Metro Vancouver totalled 60,388 in 2024. This
represents an 18.7 per cent increase compared to the 50,894 properties listed in 2023. This
was 9.7 per cent above the 55,047 properties listed in 2022.
The total number of properties listed last year was 5.7 per cent above the region’s 10-year
annual average (57,136).
Currently, the total number of homes listed for sale on the MLS® system in Metro Vancouver
is 10,948, a 24.4 per cent increase compared to December 2024 (8,802). This total is also 25.3
per cent above the 10-year seasonal average (8,737).
The MLS® Home Price Index composite benchmark price for all residential properties in
Metro Vancouver is currently $1,171,500. This represents a 0.5 per cent increase over
December 2023 and a 0.1 per cent decrease compared to November 2024.
“Disappointingly, sales came in shy of our forecasted target for the year, but the December
figures signal an emerging pattern of strength in home sales, building on the momentum
seen in previous months,” Lis said. “These more recent sales figures are now trending back
towards long-term historical averages, which suggests there may still be quite a bit of
potential upside for sales as we head into 2025, should the recent strength continue.
“Although sales activity had a slower start to the year, price trends began 2024 on the rise
and closed out the year on a flatter trajectory. Most market segments saw year-over-year
increases of a few per cent except for apartment units, which ended 2024 roughly flat. With
the data showing renewed strength to finish the year however, it looks as though the 2025
market is positioned to be considerably more active than we’ve seen in recent years.”
December 2024 summary
Residential sales in the region totalled 1,765 in December 2024, a 31.2 per cent increase from
the 1,345 sales recorded in December 2023. This was 14.9 per cent below the 10-year seasonal
average (2,074) for the month.
There were 1,676 detached, attached and apartment properties newly listed for sale on the
MLS® system in Metro Vancouver in December 2024. This represents a 26.3 per cent increase
compared to the 1,327 properties listed in December 2023. This was 1.1 per cent below the 10-
year seasonal average (1,695).
Across all detached, attached and apartment property types, the sales-to-active listings ratio
for December 2024 is 16.8 per cent. By property type, the ratio is 12.1 per cent for detached
homes, 23.6 per cent for attached, and 18.7 per cent for apartments.
Analysis of the historical data suggests downward pressure on home prices occurs when the
ratio dips below 12 per cent for a sustained period, while home prices often experience
upward pressure when it surpasses 20 per cent over several months.
Sales of detached homes in December 2024 reached 494, a 31.4 per cent increase from the
376 detached sales recorded in December 2023. The benchmark price for a detached home
is $1,997,000. This represents a two per cent increase from December 2023 and is nearly
unchanged compared to November 2024.
Sales of apartment homes reached 891 in December 2024, a 23.9 per cent increase
compared to the 719 sales in December 2024. The benchmark price of an apartment home is
$749,900. This represents a 0.1 per cent decrease from December 2023 and a 0.4 per cent
decrease compared to November 2024.
Attached home sales in December 2024 totalled 371, a 55.9 per cent increase compared to
the 238 sales in December 2024. The benchmark price of a townhouse is $1,114,600. This
represents a 3.4 per cent increase from December 2023 and a 0.3 per cent decrease
compared to November 2024.
READ MORE HERE
Editor’s Note:
1. Areas covered by Greater Vancouver REALTORS® include: Bowen Island, Burnaby, Coquitlam, Maple Ridge, New
Westminster, North Vancouver, Pitt Meadows, Port Coquitlam, Port Moody, Richmond, South Delta, Squamish,
Sunshine Coast, Vancouver, West Vancouver, and Whistler.
2. On February 12, 2024, the Real Estate Board of Greater Vancouver changed its organizational name to Greater
Vancouver REALTORS®.
Greater Vancouver REALTORS® is an association representing more than 15,000 REALTORS® and their
companies. The association provides a variety of member services, including the Multiple Listing Service®. For
more information on real estate, statistics, and buying or selling a home, contact a local REALTOR® or visit
www.gvrealtors.ca.
News Release
FOR IMMEDIATE RELEASE:
Home buyer demand continues to strengthen in November
VANCOUVER, BC – December 3, 2024 – Home sales registered in the MLS® in the Metro Vancouver1 market rose 28 percent year-over-year in November, building on the momentum of the 30 percent year-over-year increase seen in October.
The Greater Vancouver REALTORS® (GVR)2 reports that residential sales in the region totalled 2,181 in November 2024, a 28.1 per cent increase from the 1,702 sales recorded in November 2023. This was 12.8 per cent below the 10-year seasonal average (2,500).
“When we saw demand pick up in October, there was still a question over whether it was a blip in the data or the start of an emerging trend,” Andrew Lis, GVR’s director of economics and data analytics said. “While the November market isn’t quite a Cyber Monday door- crasher, buyers are continuing to take advantage of the relatively balanced market conditions while they last.”
There were 3,725 detached, attached and apartment properties newly listed for sale on the Multiple Listing Service® (MLS®) in Metro Vancouver in November 2024. This represents a 10.6 per cent increase compared to the 3,369 properties listed in November 2023. This was 5.4 per cent above the 10-year seasonal average (3,535).
The total number of properties currently listed for sale on the MLS® system in Metro Vancouver is 13,245, a 21.2 per cent increase compared to November 2023 (10,931). This is 26.1 per cent above the 10-year seasonal average (10,502).
Across all detached, attached and apartment property types, the sales-to-active listings ratio for November 2024 is 17.1 per cent. By property type, the ratio is 12.7 per cent for detached homes, 23.1 per cent for attached, and 18.7 per cent for apartments.
Analysis of the historical data suggests downward pressure on home prices occurs when the ratio dips below 12 per cent for a sustained period, while home prices often experience upward pressure when it surpasses 20 per cent over several months.
“Although demand has increased as we head into year-end, the number of newly listed properties coming to market in November remained sufficient to keep prices steady across all segments,” Lis said. “But as we move into the New Year, if the strength in demand continues at the current pace, and the pace of newly listed properties coming to market doesn’t keep up, it may not be long until we see the return of upward pressure on prices.”
The MLS® Home Price Index composite benchmark price for all residential properties in Metro Vancouver is currently $1,172,100. This represents a 0.9 per cent decrease over November 2023 and nearly unchanged compared to October 2024.
Sales of detached homes in November 2024 reached 626, a 19.7 per cent increase from the 523 detached sales recorded in November 2023. The benchmark price for a detached home is $1,997,400. This represents a one per cent increase from November 2023 and a 0.3 per cent decrease compared to October 2024.
Sales of apartment homes reached 1,089 in November 2024, a 28.1 per cent increase compared to the 850 sales in November 2023. The benchmark price of an apartment home is $752,800. This represents a 1.2 per cent decrease from November 2023 and a 0.6 per cent decrease compared to October 2024.
Attached home sales in November 2024 totalled 451, a 42.7 per cent increase compared to the 316 sales in November 2023. The benchmark price of a townhouse is $1,117,600. This represents a 1.8 per cent increase from November 2023 and a 0.8 per cent increase compared to October 2024.
Read more here
From Greater Vancouver Realtors:
News Release
FOR IMMEDIATE RELEASE:
Buyer demand surges in October
VANCOUVER, BC – November 4, 2024 – After months of tracking approximately twenty per cent below the ten-year seasonal average, Metro Vancouver1 home sales surged more than 30 per cent year-over-year in October.
The Greater Vancouver REALTORS® (GVR) reports that residential sales registered on the Multiple Listing Service® (MLS®) in the region totalled 2,632 in October 2024, a 31.9 per cent increase from the 1,996 sales recorded in October 2023. This was 5.5 per cent below the 10- year seasonal average (2,784).
“Typically, reductions to mortgage rates boost demand, and the strong October sales numbers suggest buyers may finally be responding to lower borrowing costs after waiting on the sidelines for months,” Andrew Lis, GVR’s director of economics and data analytics said. “To some market watchers, this rebound may come as a surprise, but with four consecutive rate cuts from the Bank of Canada – and more likely to come on the horizon – it was only a matter of time until signs of renewed strength in demand showed up.”
There were 5,452 detached, attached and apartment properties newly listed for sale on the MLS® in Metro Vancouver in October 2024. This represents a 16.9 per cent increase compared to the 4,664 properties listed in October 2023. This was 20 per cent above the 10- year seasonal average (4,545).
The total number of properties currently listed for sale on the MLS® system in Metro Vancouver is 14,477, a 24.8 per cent increase compared to October 2023 (11,599). This total is also 26.2 per cent above the 10-year seasonal average (11,475).
Across all detached, attached and apartment property types, the sales-to-active listings ratio for October 2024 is 18.8 per cent. By property type, the ratio is 13.4 per cent for detached homes, 22.5 per cent for attached, and 22.2 per cent for apartments.
Analysis of the historical data suggests downward pressure on home prices occurs when the ratio dips below 12 per cent for a sustained period, while home prices often experience upward pressure when it surpasses 20 per cent over several months.
“While the strength in October's numbers is encouraging, one data point does not make a trend," Lis said. "Recent data shows that market conditions have been decidedly balanced, with prices easing over the past few months. With the recent uptick in sales however, the attached and apartment segments are now tilting toward a seller’s market with the detached segment not far behind, suggesting the recent period of price moderation may be nearing an end."
The MLS® Home Price Index composite benchmark price for all residential properties in Metro Vancouver is $1,172,200. This represents a 1.9 per cent decrease over October 2023 and a 0.6 per cent decrease compared to September 2024.
Sales of detached homes in October 2024 reached 724, a 25.5 per cent increase from the 577 detached sales recorded in October 2023. The benchmark price for a detached home is $2,002,900. This represents a 0.3 per cent increase from October 2023 and a 1 per cent decrease compared to September 2024.
Sales of apartment homes reached 1,393 in October 2024, a 33.4 per cent increase compared to the 1,044 sales in October 2023. The benchmark price of an apartment home is $757,200. This represents a 1.6 per cent decrease from October 2023 and a 0.6 per cent decrease compared to September 2024.
Attached home sales in October 2024 totalled 501, a 40.7 per cent increase compared to the 356 sales in October 2023. The benchmark price of a townhouse is $1,108,800. This represents a 0.4 per cent increase from October 2023 and a 0.9 per cent increase compared to September 2024.
News Release
FOR IMMEDIATE RELEASE:
Buyers remain cautious to begin the fall market
VANCOUVER, BC – October 2, 2024 – Home sales registered on the MLS® in Metro
Vancouver1 declined 3.8 per cent year over year in September, suggesting recent reductions
in borrowing costs are having a limited effect in spurring demand so far.
Greater Vancouver REALTORS® (GVR)2 reports that residential sales in the region totalled
1,852 in September 2024, a 3.8 per cent decrease from the 1,926 sales recorded in September
2023. This was 26 per cent below the 10-year seasonal average (2,502).
“Real estate watchers have been monitoring the data for signs of renewed strength in
demand in response to recent mortgage rate reductions, but the September figures don’t
offer the signal that many are watching for,” Andrew Lis, GVR’s director of economics and
data analytics said. “Sales continue trending roughly 25 per cent below the ten-year seasonal
average in the region, which, believe it or not, is a trend that has been in place for a few years
now. With the September data, sales are now tracking slightly below our forecast however,
but we remain optimistic sales will still end 2024 higher than 2023.”
There were 6,144 detached, attached and apartment properties newly listed for sale on the
Multiple Listing Service® (MLS®) in Metro Vancouver in September 2024. This represents a
12.8 per cent increase compared to the 5,446 properties listed in September 2023. This was
also 16.7 per cent above the 10-year seasonal average (5,266).
The total number of properties currently listed for sale on the MLS® system in Metro
Vancouver is 14,932, a 31.2 per cent increase compared to September 2023 (11,382). This is
24.2 per cent above the 10-year seasonal average (12,027).
Across all detached, attached and apartment property types, the sales-to-active listings ratio
for September 2024 is 12.8 per cent. By property type, the ratio is 9.1 per cent for detached
homes, 16.9 per cent for attached, and 14.6 per cent for apartments.
Analysis of the historical data suggests downward pressure on home prices occurs when the
ratio dips below 12 per cent for a sustained period, while home prices often experience
upward pressure when it surpasses 20 per cent over several months.
“With some buyers choosing to stay on the sidelines, inventory levels have sustained the
healthy gains achieved over the course of this year, providing much more selection to anyone
searching for a home,” Lis said.
With all this choice available, prices have trended sideways for the past few months. The
September figures, however, are now showing modest declines across all segments on a
month over month basis. This downward pressure on prices is a result of sales not keeping
pace with the number of newly listed properties coming to market, which has now put the
overall market on the cusp of a buyers’ market. With two more policy rate decisions to go this
year, and all signs pointing to further reductions, it’s not inconceivable that demand may still
pick up later this fall should buyers step off the sidelines.”
The MLS® Home Price Index composite benchmark price for all residential properties in
Metro Vancouver is currently $1,179,700. This represents a 1.8 per cent decrease over
September 2023 and a 1.4 per cent decrease compared to August 2024.
Sales of detached homes in September 2024 reached 516, a 9.8 per cent decrease from the
572 detached sales recorded in September 2023. The benchmark price for a detached home
is $2,022,200. This represents a 0.5 per cent increase from September 2023 and a 1.3 per cent
decrease compared to August 2024.
Sales of apartment homes reached 940 in September 2024, a 4.9 per cent decrease
compared to the 988 sales in September 2023. The benchmark price of an apartment home is
$762,000. This represents a 0.8 per cent decrease from September 2023 and a 0.8 per cent
decrease compared to August 2024.
Attached home sales in September 2024 totalled 378, a 7.4 per cent increase compared to
the 352 sales in September 2023. The benchmark price of a townhouse is $1,099,200. This
represents a 0.5 per cent decrease from September 2023 and a 1.8 per cent decrease
compared to August 2024.
See full stats here
News Release from Greater Vancouver Realtors
FOR IMMEDIATE RELEASE:
Sellers await buyers’ return after quieter summer market
VANCOUVER, BC – September 4, 2024 – Home sales registered on the MLS® in Metro
Vancouver1 remained below their ten-year seasonal averages in August as summer holidays
come to a close.
Greater Vancouver REALTORS® (GVR)2 reports that residential sales in the region totalled
1,904 in August 2024, a 17.1 percent decrease from the 2,296 sales recorded in August 2023.
This total was also 26 percent below the 10-year seasonal average (2,572).
“From a seasonal perspective, August is typically a slower month for sales than June or July. In
this respect, this August has been no different,” Andrew Lis, GVR’s director of economics and
data analytics said. “With that said, sales remain in a holding pattern, trending roughly 20 per
cent below their 10-year seasonal average, which suggests buyers are still feeling the pinch of
higher borrowing costs, despite two recent quarter percentage point reductions to the policy
rate this summer.”
There were 4,109 detached, attached and apartment properties newly listed for sale on the
Multiple Listing Service® (MLS®) in Metro Vancouver in August 2024. This represents a 4.2 per
cent increase compared to the 3,943 properties listed in August 2023. This total was 1.7 per
cent below the 10-year seasonal average (4,179).
The total number of properties currently listed for sale on the MLS® system in Metro
Vancouver is 13,812, a 37 percent increase compared to August 2023 (10,082). This total is
also 20.8 percent above the 10-year seasonal average (11,432).
Across all detached, attached and apartment property types, the sales-to-active listings ratio
for August 2024 is 14.3 percent. By property type, the ratio is 9.6 percent for detached
homes, 18 percent for attached, and 17.2 percent for apartments.
Analysis of the historical data suggests downward pressure on home prices occurs when the
ratio dips below 12 percent for a sustained period, while home prices often experience
upward pressure when it surpasses 20 percent over several months.
“Buyers’ hesitancy to enter the market, paired with new listing activity on the part of sellers
that is in line with historical averages, has allowed inventory to accumulate for a number of
months and has moved the market firmly into balanced conditions,” Lis said.
“With the Bank of Canada’s decision to reduce the policy rate today by another quarter
percentage point, and with September being a month that typically sees an increase in sales
from a seasonal perspective, the fall market is set up to bring more buyers off the sidelines.
We will watch the upcoming September data to see whether they decide to show up.”
The MLS® Home Price Index composite benchmark price for all residential properties in
Metro Vancouver is currently $1,195,900. This represents a 0.9 percent decrease over August
2023 and a 0.13 percent decrease compared to July 2024.
Sales of detached homes in August 2024 reached 509, a 13.9 percent decrease from the 591
detached sales recorded in August 2023. The benchmark price for a detached home is
$2,048,400. This represents a 1.8 percent increase from August 2023 and a 0.1 percent
decrease compared to July 2024.
Sales of apartment homes reached 1,012 in August 2024, a 20.3 percent decrease compared
to the 1,270 sales in August 2023. The benchmark price of an apartment home is $768,200.
This represents a 0.1 percent decrease from August 2023 and is unchanged compared to
July 2024.
Attached home sales in August 2024 totalled 370, a 12.3 percent decrease compared to the
422 sales in August 2023. The benchmark price of a townhouse is $1,119,300. This represents a
0.8 percent increase from August 2023 and a 0.5 percent decrease compared to July 2024.
See full stats here
Celebrate the Ws
When we penned our first-half (H1) forecast for the Greater Vancouver residential market in January, our outlook called for a steady pace of sales similar to 2023 paired with modest price growth of a few percent across all market segments.
Our report also made a few additional predictions1 worth revisiting as we enter the second half (H2) of 2024:
READ MORE HERE
From Vancouver Realtors:
More selection is not translating into more transactions
VANCOUVER, BC – August 2, 2024 – Newly listed properties registered on the Multiple Listing
Service® (MLS®) rose nearly twenty percent year over year in July, helping to sustain a
a healthy level of inventory in the Metro Vancouver1 housing market.
On the demand side, the Greater Vancouver REALTORS®2 (GVR) reports that residential sales
in the region totalled 2,333 in July 2024, a 5 percent decrease from the 2,455 sales recorded in
July 2023. This was 17.6 percent below the 10-year seasonal average (2,831).
“The trend of buyers remaining hesitant, which began a few months ago, continued in the July
data despite a fresh quarter percentage point cut to the Bank of Canada’s policy rate,”
Andrew Lis, GVR’s director of economics and data analytics said. “With the recent half
percentage point decline in the policy rate over the past few months, and with so much
inventory to choose from, it’s a bit surprising transaction levels remain below historical norms
as we enter the mid-point of summer.”
Read more here
Market shifting in Buyers' favour, though hesitation remains:
VANCOUVER, BC – July 3, 2024 – Metro Vancouver1 home sales registered on the MLS®
remained below seasonal and historical averages in June. With reduced competition among
buyers, inventory has continued to accumulate to levels not seen since the spring of 2019.
Read more here
VANCOUVER, BC – June 4, 2024 – The number of transactions on the Multiple Listing
Service® (MLS®) declined in May compared to what is typical for this time of year in Metro
Vancouver1. This shift has allowed the inventory of homes available for sale to continue to
accumulate with over 13,000 homes now actively listed on the MLS® in the region.
The Greater Vancouver REALTORS® (GVR)2 reports that residential sales in the region totalled
2,733 in May 2024, a 19.9 per cent decrease from the 3,411 sales recorded in May 2023. Last
month’s sales total was also down 19.6 per cent from the 10-year seasonal average for May
(3,398).
“The surprise in the May data is that sales have come in softer than what we’d typically
expect to see at this point in the year, while the number of newly listed homes for sale is
carrying some of the momentum seen in the April data,” Andrew Lis, GVR’s director of
economics and data analytics said. “It’s a natural inclination to chalk these trends up to one
factor or another, but what we’re seeing is a culmination of factors influencing buyer and
seller decisions in the market right now. It’s everything from higher borrowing costs, to worries
about the economy, to policy interventions imposed by various levels of government.”
There were 6,374 detached, attached and apartment properties newly listed for sale on the
MLS® in Metro Vancouver in May 2024. This represents a 12.6 per cent increase compared to
the 5,661 properties listed in May 2023 and a seven per cent increase compared to the 10-year
seasonal average (5,958).
The total number of properties currently listed for sale on the MLS® system in Metro
Vancouver is 13,600, a 46.3 per cent increase compared to May 2023 (9,293). This total is also
up 19.9 per cent above the 10-year seasonal average (11,344).
Across all detached, attached and apartment property types, the sales-to-active listings ratio
for May 2024 is 20.8 per cent. By property type, the ratio is 16.8 per cent for detached homes,
25.1 per cent for attached, and 22.5 per cent for apartment properties.
Analysis of the historical data suggests downward pressure on home prices occurs when the
ratio dips below 12 per cent for a sustained period, while home prices often experience
upward pressure when it surpasses 20 per cent over several months.
“With market trends now tilting back toward more balanced conditions, as the number of
new listings outpaces the number of sales, we should expect to see slower price growth over
the coming months,” Lis said. “Up until recently, prices were climbing modestly across all
market segments. But with rising inventory levels and softening demand, buyers who’ve been
waiting for an opportunity might have more luck this summer, even if borrowing costs remain
elevated.”
The MLS® Home Price Index (HPI) composite benchmark price3 for all residential properties in
Metro Vancouver is currently $1,212,000. This represents a 2.3 per cent increase over May
2023 and a 0.5 per cent increase compared to April 2024.
Sales of detached homes in May 2024 reached 846, an 18.9 per cent decrease from the 1,043
detached sales recorded in May 2023. The benchmark price for a detached home is
$2,062,600. This represents a 5.9 per cent increase from May 2023 and a 1.3 per cent increase
compared to April 2024.
Sales of apartment homes reached 1,338 in May 2024, a 22.7 per cent decrease compared to
the 1,730 sales in May 2023. The benchmark price of an apartment home is $776,200. This
represents a 2.2 per cent increase from May 2023 and a 0.3 per cent decrease compared to
April 2024.
Attached home sales in May 2024 totalled 523, a 14 per cent decrease compared to the 608
sales in May 2023. The benchmark price of a townhouse is $1,145,500. This represents a 5.2
per cent increase from May 2023 and a 0.9 per cent increase compared to April 2024.
READ MORE HERE
From GREATER VANCOUVER REALTORS:
https://www.gvrealtors.ca/news-archive/april-2024-market-insights.html
Home sellers awaken this spring, bringing much-needed inventory to the housing market |
|
While Metro Vancouver home sellers appeared somewhat hesitant in January, new listings rose 31 per cent year-over-year in February, bringing a significant number of newly listed properties to the market.
Greater Vancouver REALTORS® (GVR) reports that residential sales in the region totalled 2,070 in February 2024, a 13.5 per cent increase from the 1,824 sales recorded in February 2023. This was 23.3 per cent below the 10-year seasonal average (2,699).
“While the pace of home sales started the year off briskly, the pace of newly listed properties in January was slower by comparison. A continuation of this pattern in February would have been concerning, as it could quickly tilt the market towards overheated conditions,” Andrew Lis, GVR’s director of economics and data analytics said. “With new listings up about 31 per cent year-over-year in February, this will relieve some of the pressure that was building in January and offer buyers more choice as we enter the spring and summer markets.”
There were 4,560 detached, attached and apartment properties newly listed for sale on the Multiple Listing Service® (MLS®) in Metro Vancouver in February 2024. This represents a 31.1 per cent increase compared to the 3,478 properties listed in February 2023. This was 0.2 per cent below the 10-year seasonal average (4,568).
The total number of properties currently listed for sale on the MLS® system in Metro Vancouver is 9,634, a 16.3 per cent increase compared to February 2023 (8,283). This is three per cent above the 10-year seasonal average (9,352).
Across all detached, attached and apartment property types, the sales-to-active listings ratio for February 2024 is 22.4 per cent. By property type, the ratio is 16 per cent for detached homes, 27.9 per cent for attached, and 25.9 per cent for apartments.
Analysis of the historical data suggests downward pressure on home prices occurs when the ratio dips below 12 per cent for a sustained period, while home prices often experience upward pressure when it surpasses 20 per cent over several months.
“Even with the increase in new listings however, standing inventory levels were not high enough relative to the pace of sales to mitigate price acceleration in February, with most segments of the market moving into sellers’ territory,” Lis said. “This competitive dynamic has led to modest price growth across all market segments this month, but it’s noteworthy that benchmark prices remain below the peak observed in the spring of 2022, before the market internalized the full effect of the Bank of Canada’s tightening cycle.”
The MLS® Home Price Index composite benchmark price for all residential properties in Metro Vancouver is currently $1,183,300. This represents a 4.5 per cent increase over February 2023 and a 1.9 per cent increase compared to January 2024.
Sales of detached homes in February 2024 reached 560, an 8.3 per cent increase from the 517 detached sales recorded in February 2023. The benchmark price for a detached home is $1,972,400. This represents a 7.2 per cent increase from February 2023 and a 1.5 per cent increase compared to January 2024.
Sales of apartment homes reached 1,092 in February 2024, a 17.7 per cent increase compared to the 928 sales in February 2023. The benchmark price of an apartment home is $770,700. This represents a 5.6 per cent increase from February 2023 and a 2.5 per cent increase compared to January 2024.
Attached home sales in February 2024 totalled 403, a 10.1 per cent increase compared to the 366 sales in February 2023. The benchmark price of a townhouse is $1,094,700. This represents a 4.2 per cent increase from February 2023 and a 2.6 per cent increase compared to January 2024. |
Click here for full stats package
While the Metro Vancouver market ended 2023 in balanced market territory, conditions in January began shifting back in favour of sellers as the pace of newly listed properties did not keep up with the jump in home sales.
The Real Estate Board of Greater Vancouver (REBGV) reports that residential sales in the region totalled 1,427 in January 2024, a 38.5 per cent increase from the 1,030 sales recorded in January 2023. This was 20.2 per cent below the 10-year seasonal average (1,788).
“It’s hard to believe that January sales figures came in so strong after such a quiet December, which saw many buyers and sellers delaying major decisions,” Andrew Lis, REBGV’s director of economics and data analytics said. “If sellers don’t step off the sidelines soon, the competition among buyers could tilt the market back into sellers’ territory as the available inventory struggles to keep pace with demand.”
There were 3,788 detached, attached and apartment properties newly listed for sale on the Multiple Listing Service® (MLS®) in Metro Vancouver in January 2024. This represents a 14.5 per cent increase compared to the 3,308 properties listed in January 2023. This was 9.1 per cent below the 10-year seasonal average (4,166).
The total number of properties currently listed for sale on the MLS® system in Metro Vancouver is 8,633, a 9.8 per cent increase compared to January 2023 (7,862). This is 0.3 per cent below the 10-year seasonal average (8,657).
Across all detached, attached and apartment property types, the sales-to-active listings ratio for January 2024 is 17.2 per cent. By property type, the ratio is 11.9 per cent for detached homes, 22.9 per cent for attached, and 19.9 per cent for apartments.
Analysis of the historical data suggests downward pressure on home prices occurs when the ratio dips below 12 per cent for a sustained period, while home prices often experience upward pressure when it surpasses 20 per cent over several months.
“Our 2024 forecast is calling for a two to three per cent increase in prices by the end of the year, which is largely the result of demand, once again, butting up against too little inventory,” Lis said. “If the January figures are indicative of what the spring market has in store, our forecast may already be off to an overly conservative start. Markets can shift quickly, however, and we’ll watch the February numbers to see if these early signs of strength continue, or whether they’re a blip in the data.”
The MLS® Home Price Index composite benchmark price for all residential properties in Metro Vancouver is currently $1,161,300. This represents a 4.2 per cent increase over January 2023 and a 0.6 per cent decrease compared to December 2023.
Sales of detached homes in January 2024 reached 379, a 28 per cent increase from the 296 detached sales recorded in January 2023. The benchmark price for a detached home is $1,942,400. This represents a 7.3 per cent increase from January 2023 and a 1.1 per cent decrease compared to December 2023.
Sales of apartment homes reached 746 in January 2024, a 30.6 per cent increase compared to the 571 sales in January 2023. The benchmark price of an apartment home is $751,900. This represents a 4.4 per cent increase from January 2023 and a 0.1 per cent increase compared to December 2023.
Attached home sales in January 2024 totalled 285, a 82.7 per cent increase compared to the 156 sales in January 2023. The benchmark price of a townhouse is $1,066,700. This represents a 4.3 per cent increase from January 2023 and a 0.6 per cent decrease compared to December 2023.
Download the January 2024 stats package.
Metro Vancouver housing market shows resilience in 2023, ending the year in balanced territory
Metro Vancouver’s housing market closed out 2023 with balanced market conditions, but the year-end totals mask a story of surprising resilience in the face of the highest borrowing costs seen in over a decade.
The Real Estate Board of Greater Vancouver (REBGV) reports that residential sales in the region totalled 26,249 in 2023, a 10.3 per cent decrease from the 29,261 sales recorded in 2022, and a 41.5 per cent decrease from the 44,884 sales in 2021.
Last year’s sales total was 23.4 per cent below the 10-year annual sales average (34,272).
“You could miss it by just looking at the year-end totals, but 2023 was a strong year for the Metro Vancouver housing market considering that mortgage rates were the highest they’ve been in over a decade,” Andrew Lis, REBGV’s director of economics and data analytics said. “In our 2023 forecast, we called for modest price increases throughout the year while most other forecasters were predicting price declines. The fact that we ended the year with five-per-cent-plus gains in home prices across all market segments demonstrates that Metro Vancouver remains an attractive and desirable destination, and elevated borrowing costs alone aren’t enough to dissuade buyers determined to get into this market.”
Properties listed on the Multiple Listing Service® (MLS®) in Metro Vancouver totalled 50,893 in 2023. This represents a 7.5 per cent decrease compared to the 55,047 properties listed in 2022. This was 20.2 per cent below the 63,761 properties listed in 2021.
The total number of properties listed last year was 10.5 per cent below the region’s 10-year total annual average of (56,868).
Currently, the total number of homes listed for sale on the MLS® system in Metro Vancouver is 8,802, a 13 per cent increase compared to December 2022 (7,791). This is 0.3 per cent above the 10-year seasonal average (8,772).
The MLS® Home Price Index composite benchmark price for all residential properties in Metro Vancouver is currently $1,168,700. This represents a five per cent increase over December 2022 and a 1.4 per cent decrease compared to November 2023.
“Ultimately, the story of 2023 is one of too few homes available relative to the pool of willing and qualified buyers,” Lis said. “Sellers were reluctant to list their properties early in the year, which led to fewer sales than usual coming out of the gate. But this also led to near record-low inventory levels in the spring, which put upward pressure on prices as buyers competed for the scarce few homes available.”
“Looking back on the year, it’s hard not to wonder how we’d be closing out 2023 if mortgage rates had been a few per cent lower than they were. And it looks like we might get some insight into that question in 2024, as bond markets and professional forecasters are projecting lower borrowing costs are likely to come, with modest rate cuts expected in the first half of the New Year.”
December 2023 summary
Residential sales in the region totalled 1,345 in December 2023, a 3.2 per cent increase from the 1,303 sales recorded in December 2022. This was 36.4 per cent below the 10-year seasonal average (2,114).
There were 1,327 detached, attached and apartment properties newly listed for sale on the Multiple Listing Service® (MLS®) in Metro Vancouver in December 2023. This represents a 9.9 per cent increase compared to the 1,208 properties listed in December 2022. This was 22.7 per cent below the 10-year seasonal average (1,716).
Across all detached, attached and apartment property types, the sales-to-active listings ratio for December 2023 is 16 per cent. By property type, the ratio is 11.1 per cent for detached homes, 18.7 per cent for attached, and 19.6 per cent for apartments.
Analysis of the historical data suggests downward pressure on home prices occurs when the ratio dips below 12 per cent for a sustained period, while home prices often experience upward pressure when it surpasses 20 per cent over several months.
Sales of detached homes in December 2023 reached 376, a 1.3 per cent increase from the 371 detached sales recorded in December 2022. The benchmark price for a detached home is $1,964,400. This represents a 7.7 per cent increase from December 2022 and a 0.9 per cent decrease compared to November 2023.
Sales of apartment homes reached 719 in December 2023, a 2.4 per cent increase compared to the 702 sales in December 2022. The benchmark price of an apartment home is $751,300. This represents a 5.6 per cent increase from December 2022 and a 1.5 per cent decrease compared to November 2023.
Attached home sales in December 2023 totalled 238, a 7.2 per cent increase compared to the 222 sales in December 2022. The benchmark price of a townhouse is $1,072,700. This represents a 6.4 per cent increase from December 2022 and a 1.8 per cent decrease compared to November 2023.
Download the December 2023 stats package.
September brings more activity to the real estate market. Have a look at the Real Estate Board of Greater Vancouver's stats here.
Click on the link below and our monthly booklet will open for you:
https://mailchi.mp/6878130c3788/mid-may-2022-vancouver-housing-market-review-10670962?e=2372f61679
Seasonal slowdown brings price stability to Metro Vancouver
VANCOUVER, BC – September 5, 2023 – As summer winds to a close, higher borrowing costs have begun to permeate the Metro Vancouver1 housing market in predictable ways, with price gains cooling and sales slowing along the typical seasonal pattern.
The Real Estate Board of Greater Vancouver (REBGV) reports that residential home sales2 in the region totalled 2,296 in August 2023, a 21.4 per cent increase from the 1,892 sales recorded in August 2022. This was 13.8 per cent below the 10-year seasonal average (2,663).
“It’s been an interesting spring and summer market, to say the least” Andrew Lis, REBGV’s director of economics and data analytics said. “Borrowing costs are fluctuating around the highest levels we’ve seen in over ten years, yet Metro Vancouver’s housing market bucked many pundits’ predictions of a major slowdown, instead posting relatively strong sales numbers and year-to-date price gains north of eight per cent, regardless of home type.”
There were 3,943 detached, attached and apartment properties newly listed for sale on the Multiple Listing Service® (MLS®) in Metro Vancouver in August 2023. This represents an 18.1 per cent increase compared to the 3,340 homes listed in August 2022. This was 5.3 per cent below the 10-year seasonal average (4,164).
The total number of homes currently listed for sale on the MLS® system in Metro Vancouver is 10,082, a 0.2 per cent decrease compared to August 2022 (10,099). This was 13.4 per cent below the 10-year seasonal average (11,647).
Across all detached, attached and apartment property types, the sales-to-active listings ratio for August 2023 is 23.9 per cent. By property type, the ratio is 14.2 per cent for detached homes, 30.3 per cent for townhomes, and 31.9 per cent for apartments.
Analysis of the historical data suggests downward pressure on home prices occurs when the ratio dips below 12 per cent for a sustained period, while home prices often experience upward pressure when it surpasses 20 per cent over several months.
“It’s a bit of a tortoise and hare story this year, with sales starting the year slowly while prices increased due to low inventory levels,” Lis said. “As fall approaches, sales have caught up with the price gains, but both metrics are now slowing to a pace that is more in-line with historical seasonal patterns, and with what one might expect given that borrowing costs are where they are.”
The MLS® Home Price Index composite benchmark price for all residential properties in Metro Vancouver is currently $1,208,400. This represents a 2.5 per cent increase over August 2022 and a 0.2 per cent decrease compared to July 2023.
Sales of detached homes in August 2023 reached 591, a 13.2 per cent increase from the 522 detached sales recorded in August 2022. The benchmark price for a detached home is $2,018,500. This represents a 3.3 per cent increase from August 2022 and a 0.3 per cent increase compared to July 2023.
Sales of apartment homes reached 1,270 in August 2023, a 27.4 per cent increase compared to the 997 sales in August 2022. The benchmark price of an apartment home is $770,000. This represents a 4.4 per cent increase from August 2022 and a 0.2 per cent decrease compared to July 2023.
Attached home sales in August 2023 totalled 422, an 18.9 per cent increase compared to the 355 sales in August 2022. The benchmark price of an attached home is $1,103,900. This represents a 3.9 per cent increase from August 2022 and a 0.1 per cent decrease compared to July 2023.
1. Editor’s Note: Areas covered by the Real Estate Board of Greater Vancouver include: Bowen Island, Burnaby, Coquitlam, Maple Ridge, New Westminster, North Vancouver, Pitt Meadows, Port Coquitlam, Port Moody, Richmond, South Delta, Squamish, Sunshine Coast, Vancouver, West Vancouver, and Whistler.
2. REBGV is now including multifamily and land sales and listings in this monthly report. Previously, we only included detached, attached, and apartment sales, and these additional categories, which typically account for roughly one to two per cent of total MLS® activity per month, are being included for completeness in our reporting.
The Real Estate Board of Greater Vancouver is an association representing more than 15,000 REALTORS® and their companies. The Board provides a variety of member services, including the Multiple Listing Service®. For more information on real estate, statistics, and buying or selling a home, contact a local REALTOR® or visit www.rebgv.org.
For more information please contact:
Craig Munn
V.P., Communication and Events
Real Estate Board of Greater Vancouver 604.730.3146
[email protected]
Strong sales push Metro Vancouver home prices past the rate hike in July
Home prices across all home types in Metro Vancouver rose again in July, as strong sales figures continue to push up against low levels of housing inventory in the region.
The Real Estate Board of Greater Vancouver (REBGV) reports that residential home sales in the region totalled 2,455 in July 2023, a 28.9 per cent increase from the 1,904 sales recorded in July 2022. This was 15.6 per cent below the 10-year seasonal average (2,909).
“While sales remain about 15 per cent below the ten-year average, they are also up about 30 per cent year-over-year, which is not insignificant,” Andrew Lis, REBGV’s director of economics and data analytics said. “Looking under the hood of these figures, it’s easy to see why sales are posting such a large year-over-year percentage increase. Last July marked the point when the Bank of Canada announced their ‘super-sized’ increase to the policy rate of one full per cent, catching buyers and sellers off guard, and putting a chill on market activity at that time.”
There were 4,649 detached, attached and apartment properties newly listed for sale on the Multiple Listing Service® (MLS®) in Metro Vancouver in July 2023. This represents a 17 per cent increase compared to the 3,975 homes listed in July 2022. This was 5.2 per cent below the 10-year seasonal average (4,902).
The total number of homes currently listed for sale on the MLS® system in Metro Vancouver is 10,301, a four per cent decrease compared to July 2022 (10,734). This was 14.4 per cent below the 10-year seasonal average (12,039).
Across all detached, attached and apartment property types, the sales-to-active listings ratio for July 2023 is 24.9 per cent. By property type, the ratio is 16.5 per cent for detached homes, 32 per cent for townhomes, and 30.6 per cent for apartments.
Analysis of the historical data suggests downward pressure on home prices occurs when the ratio dips below 12 per cent for a sustained period, while home prices often experience upward pressure when it surpasses 20 per cent over several months.
“What’s interesting to see in the current market environment is that, while the Bank of Canada rate hike this July was only a quarter of a per cent, mortgage rates are now at the highest levels we’ve seen in Canada in over ten years,” Lis said. “Yet despite borrowing costs being even higher than last July, sales activity surpassed the levels we saw last year, which I think says a lot about the strength of demand in our market and buyers’ ability to adapt to and qualify for higher borrowing costs.”
The MLS® Home Price Index composite benchmark price for all residential properties in Metro Vancouver is currently $1,210,700. This represents a 0.5 per cent increase over July 2022 and a 0.6 per cent increase compared to June 2023.
Sales of detached homes in July 2023 reached 681, a 28.7 per cent increase from the 529 detached sales in July 2022. The benchmark price for a detached home is $2,012,900. This represents a 0.6 per cent increase from July 2022 and a 1.1 per cent increase compared to June 2023.
Sales of apartment homes reached 1,281 in July 2023, a 20.7 per cent increase compared to the 1,061 sales in July 2022. The benchmark price of an apartment home is $771,600. This represents a 2.6 per cent increase from July 2022 and a 0.6 per cent increase compared to June 2023.
Attached home sales in July 2023 totalled 466, a 53.3 per cent increase compared to the 304 sales in July 2022. The benchmark price of an attached home is $1,104,600. This represents a 1.2 per cent increase from July 2022 and a 0.5 per cent increase compared to June 2023.
Download the July 2023 stats package.
Competition among buyers in Metro Vancouver’s housing market heats up as summer arrives
While the year started slower than usual, Metro Vancouver’s housing market is showing signs of heating up as summer arrives, with prices increasing for the sixth consecutive month.
The Real Estate Board of Greater Vancouver (REBGV) reports that residential home sales in the region totalled 3,411 in May 2023, which is a 15.7 per cent increase from the 2,947 sales recorded in May 2022, and a 1.4 per cent decline from the 10-year seasonal average (3,458).
“Back in January, few people would have predicted prices to be up as much as they are – ourselves included,” Andrew Lis, REBGV’s director of economics and data analytics said. “Our forecast projected prices to be up modestly in 2023 by about two per cent at year-end. Instead, Metro Vancouver home prices are already up about six per cent or more across all home types at the midway point of the year.”
There were 5,661 detached, attached and apartment properties newly listed for sale on the Multiple Listing Service® (MLS®) in Metro Vancouver in May 2023. This represents an 11.5 per cent decrease compared to the 6,397 homes listed in May 2022, and was 4.3 per cent below the 10-year seasonal average (5,917).
The total number of homes currently listed for sale on the MLS® system in Metro Vancouver is 9,293, a 10.5 per cent decrease compared to May 2022 (10,382), and 20.6 per cent below the 10-year seasonal average (11,705).
Across all detached, attached and apartment property types, the sales-to-active listings ratio for May 2023 is 38.4 per cent. By property type, the ratio is 28.5 per cent for detached homes, 45 per cent for townhomes, and 45.5 per cent for apartments.
Analysis of the historical data suggests downward pressure on home prices occurs when the ratio dips below 12 per cent for a sustained period, while home prices often experience upward pressure when it surpasses 20 per cent over several months.
“You don’t have to squint to see the reason prices continue to increase. The fundamental issue remains that there are more buyers relative to the number of willing sellers in the market. This is keeping the amount of resale homes available in short supply,” Lis said. “And in a surprising twist, MLS® sales in May snapped back closer to historical averages than we’ve seen in the recent past, despite mortgage rates being where they are now, and new listing activity having been slower than usual this spring. If mortgage rates weren’t holding back market activity so much right now, I think our market would look a lot like the heydays of 2021/22, or even 2016/17.”
The MLS® Home Price Index composite benchmark price for all residential properties in Metro Vancouver is currently $1,188,000. This represents a 5.6 per cent decrease over May 2022 and a 1.3 per cent increase compared to April 2023.
Sales of detached homes in May 2023 reached 1,043, a 30.7 per cent increase from the 798 detached sales recorded in May 2022. The benchmark price for a detached home is $1,953,600. This represents a 6.7 per cent decrease from May 2022 and a 1.8 per cent increase compared to April 2023.
Sales of apartment homes reached 1,730 in May 2023, a 7.9 per cent increase compared to the 1,604 sales in May 2022. The benchmark price of an apartment home is $760,800. This represents a two per cent decrease from May 2022 and a 1.1 per cent increase compared to April 2023.
Attached home sales in May 2023 totalled 608, a 16.7 per cent increase compared to the 521 sales in May 2022. The benchmark price of an attached home is $1,083,000. This represents a 4.7 per cent decrease from May 2022 and a 0.2 per cent increase compared to April 2023.
Download the May 2023 stats package.
From The Real Estate Board of Greater Vancouver:
News Release
FOR IMMEDIATE RELEASE:
Spring brings renewed price growth across Metro Vancouver’s housing market while new listings remain dormant
VANCOUVER, BC – April 3, 2023 – Home prices across Metro Vancouver’s1 housing market showed modest increases in March, while new listings remained below long-term historical averages.
March data also indicates home sales are making a stronger than expected spring showing so far, despite elevated borrowing costs.
The Real Estate Board of Greater Vancouver (REBGV) reports that residential home sales in the region totalled 2,5352 in March 2023, a 42.5 per cent decrease from the 4,405 sales recorded in March 2022, and 28.4 per cent below the 10-year seasonal average (3,540).
The MLS® Home Price Index composite benchmark price for all residential properties in Metro Vancouver is currently $1,143,900. This represents a 9.5 per cent decrease over March 2022 and a 1.8 per cent increase compared to February 2023.
“On the pricing side, the spring market is already on track to outpace our 2023 forecast, which anticipated modest price increases of about one to two per cent across all product types,” Andrew Lis, REBGV’s director of economics and data analytics said. “The surprising part of this recent activity is that these price increases are occurring against a backdrop of elevated borrowing costs, below-average sales, and new listing activity that continues to suggest that sellers areawaiting more favorable market conditions.”
There were 4,317 detached, attached and apartment properties newly listed for sale on the Multiple Listing Service® (MLS®) in Metro Vancouver in March 2023. This represents a 35.5 per cent decrease compared to the 6,690 homes listed in March 2022, and was 22.3 per cent below the 10-year seasonal average (5,553).
The total number of homes currently listed for sale on the MLS® system in Metro Vancouver is 8,617, an 8.1 per cent increase compared to March 2022 (7,970), and 17.3 per cent below the 10- year seasonal average (10,421).
Across all detached, attached and apartment property types, the sales-to-active listings ratio for March 2023 is 30.7 per cent. By property type, the ratio is 23.3 per cent for detached homes, 36.7 per cent for townhomes, and 34.9 per cent for apartments.
Analysis of historical data suggests downward pressure on home prices occurs when the ratio dips below 12 per cent for a sustained period, while home prices often experience upward pressure when it surpasses 20 per cent over several month.
“If home sellers remain on the sidelines, monthly MLS® sales figures will continue to appear lower than historical averages as we move toward summer,” Lis said. “But it’s important to recognize the chicken-and-egg nature of these statistics. The number of sales in any given month is partially determined by the number of homes that come to market that month, along with the inventory of unsold homes listed in previous months. With fewer homes coming on the market, homes sales will remain lower than we’re accustomed to seeing at this point in the year, almost entirely by definition.”
Sales of detached homes in March 2023 reached 734, a 43.6 per cent decrease from the 1,302 detached sales recorded in March 2022. The benchmark price for detached properties is $1,861,800. This represents an 11.2 per cent decrease from March 2022 and a 2.7 per cent increase compared to February 2023.
Sales of apartment homes reached 1,311 in March 2023, a 43.2 per cent decrease compared to the 2,310 sales in March 2022. The benchmark price of an apartment property is $737,400. This represents a 4.6 per cent decrease from March 2022 and a 0.7 per cent increase compared to February 2023.
Attached home sales in March 2023 totalled 466, a 37.3 per cent decrease compared to the 743 sales in March 2022. The benchmark price of an attached unit is $1,056,400. This represents a 7.8 per cent decrease from March 2022 and a 1.7 per cent increase compared to February 2023.
1. Editor’s Note: Areas covered by the Real Estate Board of Greater Vancouver include: Bowen Island, Burnaby, Coquitlam, Maple Ridge, New Westminster, North Vancouver, Pitt Meadows, Port Coquitlam, Port Moody, Richmond, South Delta, Squamish, Sunshine Coast, Vancouver, West Vancouver, and Whistler.
2. REBGV is now including multifamily and land sales and listings in this monthly report. Previously, we only included detached, attached, and apartment sales, and these additional categories, which typically account for less than one to two per cent of total MLS® activity per month, are being included for completeness in our reporting.
The Real Estate Board of Greater Vancouver is an association representing more than 15,000 REALTORS® and their companies. The Board provides a variety of member services, including the Multiple Listing Service®. For more information on real estate, statistics, and buying or selling a home, contact a local REALTOR® or visit www.rebgv.org.
For more information please contact:
Craig Munn
V.P., Communication and Events
Real Estate Board of Greater Vancouver 604.730.3146
[email protected]
News Release
FOR IMMEDIATE RELEASE:
Below average home sales allow inventory to inch upwards
VANCOUVER, BC – March 2, 2023 – February listing data show a continued reluctance among prospective home sellers to engage in Metro Vancouver’s* housing market, leading to below-average sales activity. With sales remaining well-below historical norms, the number of available homes for sale in the region have continued inching upwards.
The Real Estate Board of Greater Vancouver (REBGV) reports that residential home sales in the region totalled 1,808 in February 2023, a 47.2 per cent decrease from the 3,424 sales recorded in February 2022, and a 76.9 per cent increase from the 1,022 homes sold in January 2023.
Last month’s sales were 33 per cent below the 10-year February sales average.
“It’s hard to sell what you don’t have, and with new listing activity remaining among the lowest in recent history, sales are struggling to hit typical levels for this point in the year,” said Andrew Lis, REBGV’s director, economics and data analytics. “On the plus side for prospective buyers, the below-average sales activity is allowing inventory to accumulate, which is keeping market conditions from straying too deeply into sellers’ market territory, particularly in the more affordably priced segments.”
There were 3,467 detached, attached and apartment properties newly listed for sale on the Multiple Listing Service® (MLS®) in Metro Vancouver in February 2023. This represents a 36.6 per cent decrease compared to the 5,471 homes listed in February 2022 and a 5.2 per cent increase compared to January 2023 when 3,297 homes were listed.
The total number of homes currently listed for sale on the MLS® system in Metro Vancouver is 7,868, a 16.7 per cent increase compared to February 2022 (6,742) and a 5.2 per cent increase compared to January 2023 (7,478).
“While we continue to expect home price trends to show year-over-year declines for a few more months, current data and market activity suggest pricing is firming up. In fact, some leading indicators suggest we may see modest price increases this spring, particularly if sales activity increases and mortgage rates hold steady,” Lis said. “In the somewhat unusual market environment we find ourselves in right now with higher mortgage rates, fewer sales, and inventory that is inching higher but remains far from abundant, working with a Realtor who understands your local market conditions and has experience navigating challenging markets is paramount.”
For all property types, the sales-to-active listings ratio for February 2023 is 23 per cent. By property type, the ratio is 16.8 per cent for detached homes, 30.1 per cent for townhomes, and 25.8 per cent for apartments.
Generally, analysts say downward pressure on home prices occurs when the ratio dips below 12 per cent for a sustained period, while home prices often experience upward pressure when it surpasses 20 per cent over several months.
The MLS® Home Price Index composite benchmark price for all residential properties in Metro Vancouver is currently $1,123,400. This represents a 9.3 per cent decrease over February 2022 and a 1.1 per cent increase compared to January 2023.
Sales of detached homes in February 2023 reached 514, a 49.1 per cent decrease from the 1,010 detached sales recorded in February 2022. The benchmark price for detached properties is $1,813,100. This represents a 12 per cent decrease from February 2022 and a 0.7 per cent increase compared to January 2023.
Sales of apartment homes reached 928 in February 2023, a 49.9 per cent decrease compared to the 1,854 sales in February 2022. The benchmark price of an apartment property is $732,200. This represents a three per cent decrease from February 2022 and a 1.6 per cent increase compared to January 2023.
Attached home sales in February 2023 totalled 366, a 34.6 per cent decrease compared to the 560 sales in February 2022. The benchmark price of an attached unit is $1,038,500. This represents a 6.3 per cent decrease from February 2022 and a 1.8 per cent increase compared to January 2023.
*Editor’s Note: Areas covered by the Real Estate Board of Greater Vancouver include: Burnaby, Coquitlam, Maple Ridge, New Westminster, North Vancouver, Pitt Meadows, Port Coquitlam, Port Moody, Richmond, South Delta, Squamish, Sunshine Coast, Vancouver, West Vancouver, and Whistler.
The Real Estate Board of Greater Vancouver is an association representing more than 15,000 REALTORS® and their companies. The Board provides a variety of member services, including the Multiple Listing Service®. For more information on real estate, statistics, and buying or selling a home, contact a local REALTOR® or visit www.rebgv.org.
For more information please contact:
Craig Munn
V.P., Communication and Events
Real Estate Board of Greater Vancouver 604.730.3146
[email protected]
For Area Stats click HERE
News Release
Home sales decline below long-term averages and inventory remains low to start 2023
VANCOUVER, BC – February 2, 2023 – Inventory remains low in Metro Vancouver* while home sales dipped well below monthly historical averages in January.
The Real Estate Board of Greater Vancouver (REBGV) reports that residential home sales in the region totalled 1,022 in January 2023, a 55.3 per cent decrease from the 2,285 sales recorded in January 2022, and a 21.1 per cent decrease from the 1,295 homes sold in December 2022.
Last month’s sales were 42.9 per cent below the 10-year January sales average.
“Due to seasonality, market activity is quieter in January. With mortgage rates having risen so rapidly over the last year, we anticipated sales this month would be among the lowest in recent history,” said Andrew Lis, REBGV’s director, economics and data analytics. “Looking forward, however, the Bank of Canada has said that it will pause further rate increases as long as the incoming economic data continues to support this policy stance. This should provide more certainty for home buyers and sellers in the market.”
There were 3,297 detached, attached and apartment properties newly listed for sale on the Multiple Listing Service® (MLS®) in Metro Vancouver in January 2023. This represents a 20.9 per cent decrease compared to the 4,170 homes listed in January 2022 and a 173.4 per cent increase compared to December 2022 when 1,206 homes were listed.
The total number of homes currently listed for sale on the MLS® system in Metro Vancouver is 7,478, a 32.1 per cent increase compared to January 2022 (5,663) and a 1.3 per cent increase compared to December 2022 (7,384).
For all property types, the sales-to-active listings ratio for January 2023 is 13.7 per cent. By property type, the ratio is 10.2 per cent for detached homes, 13.4 per cent for townhomes, and 16.7 per cent for apartments.
Generally, analysts say downward pressure on home prices occurs when the ratio dips below 12 per cent for a sustained period, while home prices often experience upward pressure when it surpasses 20 per cent over several months.
“We know the peak for prices in our market occurred last spring. Over the coming months, year- over-year data comparisons will show larger price declines than we’ve been reporting up to now,” said Lis. “It’s important to understand that year-over-year calculations are backward-looking. These price declines already happened, and what we are seeing today is that prices may have found a footing, even if it’s an awkward one sandwiched between low inventory and higher borrowing costs.”
The MLS® Home Price Index composite benchmark price for all residential properties in Metro Vancouver is currently $1,111,400. This represents a 6.6 per cent decrease over January 2022 and a 0.3 per cent decrease compared to December 2022.
Sales of detached homes in January 2023 reached 295, a 52.6 per cent decrease from the 622 detached sales recorded in January 2022. The benchmark price for a detached home is $1,801,300. This represents a 9.1 per cent decrease from January 2022 and a 1.2 per cent decrease compared to December 2022.
Sales of apartment homes reached 571 in January 2023, a 56.6 per cent decrease compared to the 1,315 sales in January 2022. The benchmark price of an apartment home is $720,700. This represents a 1.1 per cent decrease from January 2022 and a one per cent increase compared to December 2022.
Attached home sales in January 2023 totalled 156, a 55.2 per cent decrease compared to the 348 sales in January 2022. The benchmark price of an attached home is $1,020,400. This represents a three per cent decrease from January 2022 and a 0.8 per cent increase compared to December 2022.
Click on the link below to open the booklet:
https://booklet.dexterrealty.com/vancouverrealestatemarketreport2
From: The Real Estate Board of Greater Vancouver
News Release
FOR IMMEDIATE RELEASE:
Home sale and listing activity continue trending below long-term averages in November
VANCOUVER, BC – December 2, 2022 – While typically a quiet month of market activity based on seasonal patterns, November home sale and listing totals lagged below the region’s long-term averages.
The Real Estate Board of Greater Vancouver (REBGV) reports that residential home sales in the region totalled 1,614 in November 2022, a 52.9 per cent decrease from the 3,428 sales recorded in November 2021, and a 15.2 per cent decrease from the 1,903 homes sold in October 2022.
Last month’s sales were 36.9 per cent below the 10-year November sales average.
“With the most recent core inflation metrics showing a stubborn reluctance to respond significantly to the furious pace of rate increases, the Bank of Canada may choose to act more forcefully to bring inflation back toward target levels.” Andrew Lis, REBGV’s director, economics and data analytics said. “While it’s always difficult to predict what the bank will do with certainty, this persistent inflationary backdrop sets up the December 6 rate announcement to be yet another increase, making holiday-season home purchases something many people may end up foregoing this year.”
There were 3,055 detached, attached and apartment properties newly listed for sale on the Multiple Listing Service® (MLS®) in Metro Vancouver in November 2022. This represents a 22.9 per cent decrease compared to the 3,964 homes listed in November 2021 and a 24.2 per cent decrease compared to October 2022 when sellers listed 4,033 homes.
The total number of homes currently listed for sale on the MLS® system in Metro Vancouver is 9,179, a 28.5 per cent increase compared to November 2021 (7,144) and a 6.8 per cent decrease compared to October 2022 (9,852).
“Heading into 2023, the market continues the trend of shifting toward historical averages and typical seasonal norms,” Lis said. “Whether these trends continue will depend on looming economic factors and forthcoming housing policy measures on the horizon, which hold the potential to reignite uncertainty in our market.
“With that said, from a long-term structural standpoint, the current pace of listings and available inventory remain relatively tight when considered against a backdrop of continued in-migration to the province. With the recently announced increase in federal immigration targets, the state of available supply in our market remains one demand surge away from renewed price escalation, despite the inflationary environment and elevated mortgage rates.”
Generally, analysts say downward pressure on home prices occurs when the ratio dips below 12 per cent for a sustained period, while home prices often experience upward pressure when it surpasses 20 per cent over several months.
The MLS® Home Price Index composite benchmark price for all residential properties in Metro Vancouver is currently $1,131,600. This represents a 0.6 per cent decrease over November 2021, a 10.2 per cent decrease over the last six months, and a 1.5 per cent decrease compared to October 2022.
Sales of detached homes in November 2022 reached 486, a 50.8 per cent decrease from the 987 detached sales recorded in November 2021. The benchmark price for detached properties is $1,856,800. This represents a 1.7 per cent decrease from November 2021 and a 1.9 per cent decrease compared to October 2022.
Sales of apartment homes reached 847 in November 2022, a 53.7 per cent decrease compared to the 1,828 sales in November 2021. The benchmark price of an apartment property is $720,500. This represents a 3.5 per cent increase from November 2021 and a 0.9 per cent decrease compared to October 2022.
Attached home sales in November 2022 totalled 281, a 54.2 per cent decrease compared to the 613 sales in November 2021. The benchmark price of an attached unit is $1,027,900. This represents a 2.7 per cent increase from November 2021 and a 1.5 per cent decrease compared to October 2022.
*Editor’s Note: Areas covered by the Real Estate Board of Greater Vancouver include: Burnaby, Coquitlam, Maple Ridge, New Westminster, North Vancouver, Pitt Meadows, Port Coquitlam, Port Moody, Richmond, South Delta, Squamish, Sunshine Coast, Vancouver, West Vancouver, and Whistler.
The real estate industry is a key economic driver in British Columbia. In 2021, 43,999 homes changed ownership in the Board’s area, generating $2.98 billion in economic spin-off activity and an estimated 20,942 jobs. The total dollar value of residential sales transacted through the MLS® system in Greater Vancouver totalled $53.4 billion in 2021.
The Real Estate Board of Greater Vancouver is an association representing more than 14,000 REALTORS® and their companies. The Board provides a variety of member services, including the Multiple Listing Service®. For more information on real estate, statistics, and buying or selling a home, contact a local REALTOR® or visit www.rebgv.org.
For more information please contact:
Senior Writer & Communication Strategist Real Estate Board of Greater Vancouver
Mark Moldowan
604.730.3153 mmoldowan@rebgv.org
For East Vancouver and Vancouver West detailed stats click HERE
News Release
FOR IMMEDIATE RELEASE:
Inflation, rising interest rates create caution across Metro Vancouver’s housing market
VANCOUVER, BC – November 2, 2022 – Home sale activity across the Metro Vancouver* housing market continued to trend well below historical averages in October.
The Real Estate Board of Greater Vancouver (REBGV) reports that residential home sales in the region totalled 1,903 in October 2022, a 45.5 per cent decrease from the 3,494 sales recorded in October 2021, and a 12.8 per cent increase from the 1,687 homes sold in September 2022.
Last month’s sales were 33.3 per cent below the 10-year October sales average.
“Inflation and rising interest rates continue to dominate headlines, leading many buyers and sellers to assess how these factors impact their housing options,” Andrew Lis, REBGV’s director, economics and data analytics said. “With sales remaining near historic lows, the number of active listings continues to inch upward, causing home prices to recede from the record highs set in the spring of 2022.”
There were 4,033 detached, attached and apartment properties newly listed for sale on the Multiple Listing Service® (MLS®) in Metro Vancouver in October 2022. This represents a 0.4 per cent decrease compared to the 4,049 homes listed in October 2021 and a 4.6 per cent decrease compared to September 2022 when 4,229 homes were listed.
The total number of homes currently listed for sale on the MLS® system in Metro Vancouver is 9,852, a 22.6 per cent increase compared to October 2021 (8,034) and a 1.2 per cent decrease compared to September 2022 (9,971).
“Recent years have been characterized by a frenetic pace of sales amplified by scarce listings on the market to choose from. Today’s market cycle is a marked departure, with a slower pace of sales and more selection to choose from,” Lis said. “This environment provides buyers and sellers more time to conduct home inspections, strata minute reviews, and other due diligence. With the possibly of yet another rate hike by the Bank of Canada this December, it has become even more important to secure financing as early in the process as possible.”
For all property types, the sales-to-active listings ratio for October 2022 is 19.3 per cent. By property type, the ratio is 14.3 per cent for detached homes, 21.6 per cent for townhomes, and 23.2 per cent for apartments.
Generally, analysts say downward pressure on home prices occurs when the ratio dips below 12 per cent for a sustained period, while home prices often experience upward pressure when it surpasses 20 per cent over several months.
The MLS® Home Price Index composite benchmark price for all residential properties in Metro Vancouver is currently $1,148,900. This represents a 2.1 per cent increase from October 2021, a 9.2 per cent decrease over the last six months, and a 0.6 per cent decrease compared to September 2022.
Sales of detached homes in October 2022 reached 575, a 47.2 per cent decrease from the 1,090 detached sales recorded in October 2021. The benchmark price for a detached home is $1,892,100. This represents a 1.6 per cent increase from October 2021 and a 0.7 per cent decrease compared to September 2022.
Sales of apartment homes reached 995 in October 2022, a 44.8 per cent decrease compared to the 1,801 sales in October 2021. The benchmark price of an apartment home is $727,100. This represents a 5.1 per cent increase from October 2021 and a 0.2 per cent decrease compared to September 2022.
Attached home sales in October 2022 totalled 333, a 44.8 per cent decrease compared to the 603 sales in October 2021. The benchmark price of an attached unit is $1,043,600. This represents a 7.1 per cent increase from October 2021 and a 0.5 per cent decrease compared to September 2022.
|
|
|
From REBGV:
News Release
FOR IMMEDIATE RELEASE:
Home buyer demand continues to ease across Metro Vancouver VANCOUVER, BC – August 3, 2022 – Metro Vancouver’s* housing market has entered a new
cycle marked by quieter home buyer demand and a gradual rise in the supply of homes for sale.
The Real Estate Board of Greater Vancouver (REBGV) reports that residential home sales in the region totalled 1,887 in July 2022, a 43.3 per cent decrease from the 3,326 sales recorded in July 2021, and a 22.8 per cent decrease from the 2,444 homes sold in June 2022.
Last month’s sales were 35.2 per cent below the 10-year July sales average.
“Home buyers are exercising more caution in today’s market in response to rising interest rates and inflationary concerns,” Daniel John, REBGV Chair said. “This allowed the selection of homes for sale to increase and prices to edge down in the region over the last three months.”
There were 3,960 detached, attached and apartment properties newly listed for sale on the Multiple Listing Service® (MLS®) in Metro Vancouver in July 2022. This represents a 9.5 per cent decrease compared to the 4,377 homes listed in July 2021 and a 24.7 per cent decrease compared to June 2022 when 5,256 homes were listed.
The total number of homes currently listed for sale on the MLS® system in Metro Vancouver is 10,288, a 4.4 per cent increase compared to July 2021 (9,850) and a 1.3 per cent decrease compared to June 2022 (10,425).
“After two years of market conditions that favoured home sellers, home buyers now have more selection to choose from and more time to make their decision,” John said. “In today’s changing housing market, both home buyers and sellers should invest the time to understand what these changes mean for their personal circumstances.”
For all property types, the sales-to-active listings ratio for July 2022 is 18.3 per cent. By property type, the ratio is 11.8 per cent for detached homes, 20 per cent for townhomes, and 24.5 per cent for apartments.
Generally, analysts say downward pressure on home prices occurs when the ratio dips below 12 per cent for a sustained period, while home prices often experience upward pressure when it surpasses 20 per cent over several months.
The MLS® Home Price Index composite benchmark price for all residential properties in Metro Vancouver is currently $1,207,400. This represents a 10.3 per cent increase over July 2021 and a 2.3 per cent decrease compared to June 2022.
Sales of detached homes in July 2022 reached 523, a 50.2 per cent decrease from the 1,050 detached sales recorded in July 2021. The benchmark price for a detached home is $2,000,600. This represents an 11 per cent increase from July 2021 and a 2.8 per cent decrease compared to June 2022.
Sales of apartment homes reached 1,060 in July 2022, a 36.4 per cent decrease compared to the 1,666 sales in July 2021. The benchmark price of an apartment home is $755,000. This represents an 11.4 per cent increase from July 2021 and a 1.5 per cent decrease compared to June 2022.
Attached home sales in July 2022 totalled 304, a 50.2 per cent decrease compared to the 610 sales in July 2021. The benchmark price of an attached home is $1,096,500. This represents a 15.8 per cent increase from July 2021 and a 1.7 per cent decrease compared to June 2022.
|
||||
|
News Release from Real Estate Board of Greater Vancouver
FOR IMMEDIATE RELEASE:
Metro Vancouver home sales return to more traditional levels in April
VANCOUVER, BC – May 3, 2022 – Home buyer demand in Metro Vancouver* returned to more historically typical levels in April.
The Real Estate Board of Greater Vancouver (REBGV) reports that residential home sales in the region totalled 3,232 in April 2022, a 34.1 per cent decrease from the 4,908 sales recorded in April 2021, and a 25.6 per cent decrease from the 4,344 homes sold in March 2022.
Last month’s sales were 1.5 per cent above the 10-year April sales average.
“So far this spring, we’ve seen home sales ease down from the record-breaking pace of the last year,” Daniel John, REBGV Chair said. “While a small sample size, the return to a more traditional pace of home sales that we’ve experienced over the last two months provides hopeful home buyers more time to make decisions, secure financing and perform other due diligence such as home inspections.”
There were 6,107 detached, attached and apartment properties newly listed for sale on the Multiple Listing Service® (MLS®) in Metro Vancouver in April 2022. This represents a 23.1 per cent decrease compared to the 7,938 homes listed in April 2021 and an 8.5 per cent decrease compared to March 2022 when 6,673 homes were listed.
The total number of homes currently listed for sale on the MLS® system in Metro Vancouver is 8,796, a 14.1 per cent decrease compared to April 2021 (10,245) and a 15.3 per cent increase compared to March 2022 (7,628).
“With interest rates climbing and the total inventory of homes for sale inching higher, it’s important to work with your local Realtor to understand how these factors could affect your home buying or selling situation,” John said.
For all property types, the sales-to-active listings ratio for April 2022 is 36.7 per cent. By property type, the ratio is 25.3 per cent for detached homes, 47.1 per cent for townhomes, and 45 per cent for apartments.
Generally, analysts say downward pressure on home prices occurs when the ratio dips below 12 per cent for a sustained period, while home prices often experience upward pressure when it surpasses 20 per cent over several months.
The MLS® Home Price Index composite benchmark price for all residential properties in Metro Vancouver is currently $1,374,500. This represents an 18.9 per cent increase over April 2021 and a one per cent increase compared to March 2022.
Sales of detached homes in April 2022 reached 962, a 41.9 per cent decrease from the 1,655 detached sales recorded in April 2021. The benchmark price for a detached home is $2,139,200. This represents a 20.8 per cent increase from April 2021 and a one per cent increase compared to March 2022.
Sales of apartment homes reached 1,692 in April 2022, a 26.1 per cent decrease compared to the 2,289 sales in April 2021. The benchmark price of an apartment home is $844,700. This represents a 16 per cent increase from April 2021 and a 1.1 per cent increase compared to March 2022.
Attached home sales in April 2022 totalled 578, a 40 per cent decrease compared to the 964 sales in April 2021. The benchmark price of an attached home is $1,150,500. This represents a 25 per cent increase from April 2021 and a 1.1 per cent increase compared to March 2022.
Download the April 2022 stats package.
From The Real Estate Board of Greater Vancouver
Listings inch up, demand remains steady and price gains continue in Metro Vancouver’s housing market in February
The Metro Vancouver housing market saw steady home sales activity, modest increases in home listings and continued upward trends in pricing in February.
The Real Estate Board of Greater Vancouver (REBGV) reports that residential home sales in the region totalled 3,424 in February 2022, an 8.1 per cent decrease from the 3,727 sales recorded in February 2021, and a 49.8 per cent increase from the 2,285 homes sold in January 2022.
Last month’s sales were 26.9 per cent above the 10-year February sales average.
“As we prepare to enter what’s traditionally the busiest season of the year, the Metro Vancouver housing market is seeing more historically typical home sale activity and a modest uptick in home listing activity compared to last year,” Taylor Biggar, REBGV Chair said.
There were 5,471 detached, attached and apartment properties newly listed for sale on the Multiple Listing Service® (MLS®) in Metro Vancouver in February 2022. This represents an 8.4 per cent increase compared to the 5,048 homes listed in February 2021 and a 31.2 per cent increase compared to January 2022 when 4,170 homes were listed.
The total number of homes currently listed for sale on the MLS® system in Metro Vancouver is 6,742, a 19.3 per cent decrease compared to February 2021 (8,358) and a 19.1 per cent increase compared to January 2022 (5,663).
“Despite having a higher volume of people listing their homes for sale in February, the region’s housing market remains significantly undersupplied, which has been pushing home prices to new highs month after month,” Biggar said.
For all property types, the sales-to-active listings ratio for February 2022 is 50.8 per cent. By property type, the ratio is 34.9 per cent for detached homes, 64.3 per cent for townhomes, and 62.2 per cent for apartments.
Generally, analysts say downward pressure on home prices occurs when the ratio dips below 12 per cent for a sustained period, while home prices often experience upward pressure when it surpasses 20 per cent over several months.
The MLS® Home Price Index composite benchmark price for all residential properties in Metro Vancouver is currently $1,313,400. This represents a 20.7 per cent increase over February 2021 and a 4.6 per cent increase compared to January 2022.
“A lack of housing supply is at the heart of the affordability challenges in Metro Vancouver today. We need more coordinated action from stakeholders at all levels to help create an ample, diverse supply of housing options for residents in the region today and into the future,” Biggar said.
Sales of detached homes in February 2022 reached 1,010, an 18 per cent decrease from the 1,231 detached sales recorded in February 2021. The benchmark price for detached properties is $2,044,800. This represents a 25 per cent increase from February 2021 and a 4.7 per cent increase compared to January 2022.
Sales of apartment homes reached 1,854 in February 2022, a 5.4 per cent increase compared to the 1,759 sales in February 2021. The benchmark price of an apartment property is $807,900. This represents a 15.9 per cent increase from February 2021 and a 4.1 per cent increase compared to January 2022.
Attached home sales in February 2022 totalled 560, a 24 per cent decrease compared to the 737 sales in February 2021. The benchmark price of an attached unit is $1,090,000. This represents a 27.2 per cent increase from February 2021 and a 5.9 per cent increase compared to January 2022.
Download the February 2022 stats package.
From The Real Estate Board of Greater Vancouver
Low supply keeps upward pressure on home prices across Metro Vancouver’s housing market
The first month of 2022 saw home sales come down from last year’s record-setting pace, while low supply continued to cause home prices to edge higher across Metro Vancouver.
The Real Estate Board of Greater Vancouver (REBGV) reports that residential home sales in the region totalled 2,285 in January 2022, a 4.4 per cent decrease from the 2,389 sales recorded in January 2021, and a 15 per cent decrease from the 2,688 homes sold in December 2021.
Last month’s sales were 25.3 per cent above the 10-year January sales average.
There were 4,170 detached, attached and apartment properties newly listed for sale on the Multiple Listing Service® (MLS®) in Metro Vancouver in January 2022. This represents a 6.9 per cent decrease compared to the 4,480 homes listed in January 2021 and a 114.4 per cent increase compared to December 2021 when 1,945 homes were listed.
“Our listing inventory on MLS® is less than half of what would be optimal to begin the year. As a result, hopeful home buyers have limited choice in the market today. This trend is causing fierce competition for a scarce number of homes for sale, which, in turn, increases prices,” Keith Stewart, REBGV economist said.
The total number of homes currently listed for sale on the MLS® system in Metro Vancouver is 5,663, a 31.8 per cent decrease compared to January 2021 (8,306) and an 8.2 per cent increase compared to December 2021 (5,236).
“As we approach spring, we’ll keep a close eye on the impact of rising interest rates on buyers’ willingness to buy and on whether more home owners will opt to become sellers in what’s traditionally the busiest season of the year,” Stewart said. “With home prices reaching new highs in recent months, the need has never been greater for government to collaborate with the building community to expedite the creation of housing supply and provide more choice for those struggling to buy a home today.”
For all property types, the sales-to-active listings ratio for January 2022 is 40.3 per cent. By property type, the ratio is 28 per cent for detached homes, 51.6 per cent for townhomes, and 49.7 per cent for apartments.
Generally, analysts say downward pressure on home prices occurs when the ratio dips below 12 per cent for a sustained period, while home prices often experience upward pressure when it surpasses 20 per cent over several months.
The MLS® Home Price Index composite benchmark price for all residential properties in Metro Vancouver is currently $1,255,200. This represents a 18.5 per cent increase over January 2021 and a two per cent increase compared to December 2021.
Sales of detached homes in January 2022 reached 622, a 15.9 per cent decrease from the 740 detached sales recorded in January 2021. The benchmark price for a detached home is $1,953,000. This represents a 22.7 per cent increase from January 2021 and a 2.2 per cent increase compared to December 2021.
Sales of apartment homes reached 1,315 in January 2022, a 10 per cent increase compared to the 1,195 sales in January 2021. The benchmark price of an apartment property is $775,700. This represents a 14 per cent increase from January 2021 and a 1.8 per cent increase compared to December 2021.
Attached home sales in January 2022 totalled 348, a 23.3 per cent decrease compared to the 454 sales in January 2021. The benchmark price of an attached home is $1,029,500. This represents a 24.3 per cent increase from January 2021 and a 2.5 per cent increase compared to December 2021.
Download the January 2022 stats package.
Click on the link below for full report
https://booklet.dexterrealty.com/vancouverrealestatemarketreport2
News Release
FOR IMMEDIATE RELEASE:
Summer sees home listing supply decline across Metro Vancouver
VANCOUVER, BC – September 2, 2021 – While home buyers have remained active in Metro Vancouver* throughout the summer, the supply of homes for sale has declined steadily since June.
The Real Estate Board of Greater Vancouver (REBGV) reports that residential home sales in the region totalled 3,152 in August 2021, a 3.4 per cent increase from the 3,047 sales recorded in August 2020, and a 5.2 per cent decrease from the 3,326 homes sold in July 2021.
Last month’s sales were 20.4 per cent above the 10-year August sales average.
“August was busier than expected, and listings activity isn’t keeping up with the pace of demand. This is leaving the market under supplied.” said Keith Stewart, REBGV economist.
There were 4,032 detached, attached and apartment properties newly listed for sale on the Multiple Listing Service® (MLS®) in Metro Vancouver in August 2021. This represents a 30.6 per cent decrease compared to the 5,813 homes listed in August 2020 and a 7.9 per cent decrease compared to July 2021 when 4,377 homes were listed.
The total number of homes currently listed for sale on the MLS® system in Metro Vancouver is 9,005, a 29.7 per cent decrease compared to August 2020 (12,803) and an 8.6 per cent decrease compared to July 2021 (9,850).
“Housing supply is the biggest factor impacting the market right now. To help relieve pressure on prices and improve peoples’ home buying options, the market needs a more abundant supply of homes for sale.” Stewart said. “Housing affordability has been a key issue in the federal election. We encourage the political parties to focus on policy solutions that will help streamline the creation of more diverse housing options for hopeful home buyers today and into the future.”
For all property types, the sales-to-active listings ratio for August 2021 is 35 per cent. By property type, the ratio is 25.3 per cent for detached homes, 51.8 per cent for townhomes, and 39.2 per cent for apartments.
Generally, analysts say downward pressure on home prices occurs when the ratio dips below 12 per cent for a sustained period, while home prices often experience upward pressure when it surpasses 20 per cent over several months.
“When assessing the market, it’s important to understand that while year-over-year price increases have reached double digits, most of the increases happened three or more months ago,”
Stewart said. “To better understand the latest home price trends in your preferred location and home type, talk with your local REALTOR®.”
The MLS® Home Price Index composite benchmark price for all residential properties in Metro Vancouver is currently $1,176,600. This represents a 13.2 per cent increase over August 2020 and a 0.1 per cent increase compared to July 2021.
Sales of detached homes in August 2021 reached 945, a 13.7 per cent decrease from the 1,095 detached sales recorded in August 2020. The benchmark price for a detached home is $1,807,100. This represents a 20.4 per cent increase from August 2020 and a 0.3 per cent increase compared to July 2021.
Sales of apartment homes reached 1,631 in August 2021, a 22.4 per cent increase compared to the 1,332 sales in August 2020. The benchmark price of an apartment property is $735,100. This represents a 7.6 per cent increase from August 2020 and a 0.2 per cent decrease compared to July 2021.
Attached home sales in August 2021 totalled 576, a 7.1 per cent decrease compared to the 620 sales in August 2020. The benchmark price of an attached home is $952,600. This represents a 16.5 per cent increase from August 2020 and a 0.3 per cent increase compared to July 2021.
-30-
*Editor’s Note: Areas covered by the Real Estate Board of Greater Vancouver include: Burnaby, Coquitlam, Maple Ridge, New Westminster, North Vancouver, Pitt Meadows, Port Coquitlam, Port Moody, Richmond, South Delta, Squamish, Sunshine Coast, Vancouver, West Vancouver, and Whistler.
The real estate industry is a key economic driver in British Columbia. In 2020, 30,944 homes changed ownership in the Board’s area, generating $2.1 billion in economic spin-off activity and an estimated 14,728 jobs. The total dollar value of residential sales transacted through the MLS® system in Greater Vancouver totalled $33.7 billion in 2020.
The Real Estate Board of Greater Vancouver is an association representing more than 14,000 REALTORS® and their companies. The Board provides a variety of member services, including the Multiple Listing Service®. For more information on real estate, statistics, and buying or selling a home, contact a local REALTOR® or visit www.rebgv.org.
Stats by Region click here
For more information please contact:
Craig Munn
Director, Communication
Real Estate Board of Greater Vancouver 604.730.3146
[email protected]
The reality, of course, is that Vancouver’s consistently elevated prices are the very reason some people want to own as many homes as possible.
What should be surprising is that more Vancouver homeowners don’t do the same thing, especially today with both mortgage lending rates and housing supply at incredibly low levels.
In Greater Vancouver the average value of a home—a composite of detached houses, condo apartments and townhouses—has increased by $351,000 in the past five years. Since July 2020, the average detached house price in Greater Vancouver has risen by $312,000, in a region where the average annual household income is $100,600.
In the past six months, the typical Greater Vancouver home has increased in value by 13%, while the annual interest rate on mortgage is less than 3%. Homeowners can do the math. Leveraging the existing equity in a home to buy another property makes sound economic sense. Many see it as only proven way to protect a family from the ravages of inflation. It shouldn’t be surprising.
In July, however, Greater Vancouver buyers of all types faced a dilemma: the number of new listings fell to the lowest level of any month this year, down 26.4% from a year earlier and 25.2% below the level in June 2021. Fraser Valley listings hit a 40-year low. It is normal in July for both sellers and buyers to take a summer breather, especially this year following record-breaking sale and price increases. July sales were down for the fourth straight month in a market distracted by great summer weather and the lifting of most COVID-19 restrictions. The concern, though, is whether there will be enough listings to meet the inevitable uptick in demand as the summer wanes.
The gap between listings and sales is tightening. In July only 4,377 new listings of all types of homes were added to the market, but sales totaled 3,372 transactions. Total active listings across Greater Vancouver are 12.2% lower than the 10-year average for July, while sales are 13% higher.
The result is that the July sales-to-active-listing ratio was 33.3% and this tightened to 37.3% for condominium apartments and 47.7% for townhouses, the most in-demand housing sector across the Lower Mainland. The benchmark townhouse price is now $949,900, up 16% – nearly $152,000 from the same month last year, a compelling reason for investors to buy another townhouse.
The problem is finding one. Aside from the lack of listings, there are only 1,149 new townhouses under construction in all of Greater Vancouver. In the City of Vancouver just 58 new townhouses have started this year. The townhouse shortage is acute in many markets where sales outstripped supply in July, including South Delta, Maple Ridge, Port Coquitlam, Port Moody and Whistler-Pemberton. In Port Moody, for instance, there were only 17 new listings for townhouses but 47 sales in the month, exhausting the total inventory of active listings. Many other markets, such as Coquitlam where July townhouse sales accounted for 95% of listings, are close to near-zero inventory.
Balance in our real estate market will never be achieved without some serious consideration on increasing the supply long term.
Greater Vancouver: We suspect the seasonal sales slowdown in July was aggravated by buyers waiting for new listings that never arrived. Still, with 3,375 transactions, this was the sixth-highest July for sales in history, combined with the lowest number of new listings for a July in 11 years.
The July benchmark price for a Greater Vancouver detached house was $1,801,000, compared to $736,900 for a condo apartment. This helps explain why condominium apartment sales posted the largest year-over-year increase in July, rising 19%, while detached house sales were down 6% and townhouse sales, largely due to a lack of listings, were unchanged from July 2020. Condominiums accounted for 49% of all sales in July, but both new and active listings for condo apartments were down 21% from a year earlier. This compares with a 7% decline in total detached house listings and a 34% fewer listings for townhouses when compared with a year earlier.
As we roll into August and the traditionally high sales seen in September, the shortage of homes for sale, particularly in the strata sector, will be the headline news. Active listings have been falling month-over-month since May. If you are a homeowner and have considered listing, now may be the best time this year to come to a market that is packed with eager and frustrated buyers.
Fraser Valley: The inventory of active listings in the Fraser Valley fell to the lowest level in July in 40 years, after total active listings fell to 4,901, down 33% from July 2020 and 10.5% lower than in June 2021. Total sales also slowed, down 11% from June 2021 to 2,006, but were still 15% above the 10-year average for the month. A bright spot is the large inventory of townhouses on the Fraser Valley market, when compared with Greater Vancouver.
Vancouver Westside: The benchmark price of a detached house on Vancouver’s Westside in July reached $3,466,200, virtually unchanged ( up 0.2%) from a month earlier but 17.6% higher than in July 2020. With 93 sales in July, detached sales on the Westside this year total 766 houses, up from 444 in the first seven months of 2020. Condo apartment sales dominated July on the Westside with 419 transactions, at a benchmark price of $829,300. Townhouse sales dipped to 57 in July, down from 74 in June, as a lack of new listings – just 87 – kept some buyers sidelined. In all, the Westside sales to listing ratio in July was at 62%, a strong seller’s environment in Greater Vancouver’s most expensive market.
Vancouver East Side: As we have been noted for some months, Vancouver’s East Side story is one of rising sales of detached houses, easily eclipsing the more expensive Westside. In July, 144 detached houses sold in the East at a benchmark price of $1,688,500, a price nearly 50% lower than the 93 houses sold west of Quebec Street. Investors are very active right across the East Side, especially in the condominium market, spurred on by the visual start of the Broadway Corridor SkyTrain extension and settling down of price increases, which has seen condo prices hold steady for three months at $632,300. Townhouse sales, at 57, were the same on both the East Side and Westside in July, butt the East Side price was about $210,000 lower at a benchmark of $1,165,000. The supply of total East Side residential listings is steady at three months and the sales- to-listings ratio in July is a high 74%, signalling a continued seller’s market.
North Vancouver: North Vancouver District leaders were voted in two years ago with pledge to slow residential development. In July, after a year-long review, the District now says it wants to increase the supply, but to prioritize “rental, social, and supportive housing projects.” Bottom line is little will be done to address the acute shortage of market housing. In June, latest monthly data available, only 17 new homes had started in all of North Vancouver and there were no townhouse starts at all. The lack of supply has led to the second-highest suburban home prices in Metro Vancouver, at a composite benchmark of $1,226,000. July total housing sales across North Vancouver, at 252, were down 22% from June, one of the biggest drops in the region and off 6% from July 2020. Active listings plunged to 512 in July, down from 620 in June. The month’s supply of total residential listings is a tight two-months, and a sales-to-new-listings ratio of 84% keeps North Vancouver among the strongest seller’s market in the province.
West Vancouver: Perhaps the most prestigious housing enclave in Canada, with a July benchmark house price of $3,121,800, West Vancouver detached house sales dipped to 54 transactions in July, down from 60 a month earlier but unchanged compared to July 2020. A total of 21 condos sold in July at a benchmark of $995,000. Active listings were at 572 in June, compared to 618 at the end of June. New listings were down 25% from June 202 and 20% below July 2020. West Vancouver is a relatively balanced on high-priced perch, with about a seven-month supply and a sales-to-listing ratio in July at 53%, up from 42% a month earlier.
Richmond: Total housing sales and new listings both dropped sharply in July, down, respectively, 11% and 15% from a month earlier. The big drop was seen in detached house transactions, which fell to 94, down 61% from June, even as the benchmark house price held steady at $1,910,000. Condo sales were among the highest in the Metro region, with 236 apartments selling at median price of $620,000. Richmond had the highest number of new listings for townhouses, with 124, but 79% of these sold in July, pushing the benchmark townhouse price up a further 1% from a month earlier to $932,600. Richmond’s supply of total residential listings is up to a four-month’s supply, if the current sales trend continues.
Burnaby East: The smallest of the three Burnaby markets profiled, Burnaby East posted 46 total housing sales in July, down 6% from June but 32.4% higher than in July 2020. Active listings, though, dropped to just 83, down from 104 in June 2021. Benchmark detached house prices, at $1,431,000, and condo apartment prices, at $728,000, were virtually unchanged from a month earlier. The overall sales-to-listing ratio is 89%, indicating a strong seller’s market.
Burnaby North: Tunnels are being bored through Burnaby Mountain this summer for an oil pipeline that will link Burnaby’s tidewater to the Alberta oil fields. The action has apparently helped fuel demand for detached houses, as prices have increased 18.2% in the past year, the biggest increase in Burnaby, to $1,746,800. A large supply of new condo apartments completed in the Brentwood area likely affected benchmark condo prices, which were virtually unchanged in July from a month earlier, at $716,600. The overall sales-to-listing ratio of 73%, however, points to higher home prices in this seller’s market.
Burnaby South: A total of 202 residential properties sold in July, down 7% from a month earlier, but new listings dropped month-over-month by 24%, setting up a very tight 73% sales-to-listing ratio. As of the of July there were only 585 total active listings, enough to last just three months at the current sales pace. The composite benchmark detached house price in July was $1,774,500, highest in Burnaby, and up 1.1% from a month earlier.
New Westminster: Stability characterized the ‘Royal City ’in July as housing sales and prices were a near mirror image of June. Detached house sales, at 26, were identical, townhouse sales were up by one in July to 20, and apartment sales increased by 5 transactions to 113 in July.
The composite home price in July was also nearly unchanged, rising 0.9% to $721,300. The big difference was in new listings, which dropped to 20% month over month, with total active listings down 26% to 347 in July. With an overall sales-to-listing ratio of 86%, up from 61% in June, New Westminster remained a very active seller’s market this July.
Coquitlam: There are 3,060 new homes under construction right now in Coquitlam, including 231 townhouses and 2,652 apartments, most of which are condominiums. This is encouraging because active listings for resale homes are falling, dropping to 645 in July, down from 745 a month earlier. New listings fell 20% month-over-month. Sales also slowed, down 11% from June to a total of 292 in July, but benchmark prices stayed virtually unchanged, with detached house values at $1,505,400; townhouse prices up 0.5% to $847,500; and condo apartment prices rock steady from a month earlier at $588,900. The detached house sales success ratio is 105%, however, with townhouses seeing an 89% sales-to-listing ratio and 76% of condo listings selling in July, the stage is set for price appreciation if more listings don’t arrive soon.
Port Moody: The townhouse shortage is very apparent in Port Moody, where the sales-to-listing ratio in July was a startling 276%. There were just 17 new listings for townhouses in the month but there were 47 sales, meaning the inventory of total listings is disappearing quickly. I suspect there have been multiple offers as the benchmark townhouse price was up a further 1.2% in July from a month earlier, at $761,000. Sales of detached houses were also strong, with a 91% sales-to-listing ratio and benchmark prices unchanged up 0.7% from a month earlier, at $1.863,800, highest in the Tri-Cities.
Port Coquitlam: First-time buyers and investors are likely taking a close look at Port Coquitlam. The most affordable housing market in the Tri-Cities, PoCo is close enough to SkyTrain to make it accessible for commuters. The benchmark condo price, at $528,900 in July, was unchanged from June and is about $210,000 lower than the Greater Vancouver average. Total home sales in July were down 26% from June and 13% lower than in July 2020, at 103 transactions. This is a sleeper market that is awakening, reflected in the 94% sales-to-listing ratio in July.
Pitt Meadows: Perhaps it was the summer distraction in the lake-endowed community, but Pitt Meadows saw both sellers and buyers taking a break in July. New listings dropped 40% from a month earlier and sales fell 11% to just 39 transactions. The benchmark price for a detached house dipped just 0.8% month-to-month, to $1,193,800, with townhouse prices and condo apartment prices also virtually unchanged at $753,200 and $543,500, respectively. As of June there were only 33 new townhouses and no new condo apartments under construction in Pitt Meadows. A startling 106% sales-to-listing ratio in July is a signal that Pitt Meadow prices may rise if supply falls any further.
Maple Ridge: There are 157 townhouses under construction in Maple Ridge, including the 44 that started this year. Many of these new units are likely selling out, however, as the sales-to-listing ratio for resale townhouses topped 100% in July. Townhouse benchmark prices were $688,800 in July and condo apartments at $425,900, both among the lowest in Greater Vancouver. Detached house prices, at $1,129,900, were unchanged from June after rocketing up 34% year-over-year.
Ladner: The supply pressure is being felt by buyers in Ladner, where currently only 8 townhomes and 11 apartments are available for sale. There are only about 68 new townhouses under construction in all of Delta, but few are in Ladner. Active listings fell to 77 in July, down nearly 50% from a month earlier, and new listings are down 40% from a month earlier. With a sales-to-listing ratio of 122% in July, frustrated buyers bid condo prices up 2.6% in July from a month earlier, to $583,700. So far townhouse prices are holding steady at $754,200 after surging 11% over the past six months, and the detached house price is up 15.2% in the same period to a July benchmark of $1,263,400.
Tsawwassen: Don’t expect to see lot of new market residential in Tsawwassen. Even a modest 48-unit rental building is currently facing opposition. A shame, because demand remains high in this sunny community. While total sales were down 17% in July from June, new listings fell 35% and there were only 168 homes of all kind on the market at the of July, compared to 295 at the same time last year. With a sales-to-listing ratio hitting 89%, Tsawwassen’s composite home price has increased 12.3% over the past six months to $1,145,700 as of July.
Surrey: B.C.’s second-largest city is a safety valve for those who want to buy a townhouse but have difficulty finding one in Greater Vancouver. There are 1,139 new townhouses under construction in Surrey, compared to 1,149 in all of Greater Vancouver. In July, there were also 1,156 active listings for resale townhouses, com. Surrey’s average townhouse price in July was $710,200, up 1.1% from a month earlier.


More telling, perhaps, is the direction of prices, which increased just 0.2 per cent from May, the lowest month-over-month increase in at least a year. As June ended, the composite price of all homes sold in Greater Vancouver was $1,175,100. The value of detached houses sold was unchanged from a month earlier at $1,801,000.
But sharp eyes will notice an anomaly: outlying markets that had been posting the highest year-over-year price increases reported the biggest month-over-month decline in detached house prices in June.
Detached house prices on Bowen Island, which had soared 34% annually as of May, posted a 0.9% price decline in June compared to May. Whistler, where prices had jumped 38% from a year earlier, had prices drop 1.8% in June from a month earlier. Ladner prices fell 0.6% from May to June, after seeing an annual acceleration of 27%.
Meanwhile on Vancouver’s West Side – the epicenter of B.C. urbanity – the benchmark price of a detached house increased 2.2 per cent in June from May, the highest increase in Greater Vancouver.
We don’t think this is surprising, or a short-term trend. September is expected to welcome in the fourth and final phase of B.C.’s post-pandemic reopening. This means international borders will open, all businesses will be back in action and thousands of workers will return to the office. The big city will look increasingly tempting as hockey games open to crowds, major concerts tune up and Vancouver’s restaurants, pubs and theatres are open for business.
Expect to see home sales and prices, not just in Vancouver but across the entire region, continue to increase. The reason is quite simply the undeniable law of supply of demand.
From 2010 to 2020, B.C.’s population increased by 737,206 while only 316,510 housing units were built. In 2020, just 39,000 housing units were completed in B.C., up just 3% from 2019.
Some catch-up is taking place. In the first five months of this year, Metro Vancouver new home registrations were up 69% compared to the same period in 2020. About 18,000 new non-rental homes were registered in Metro Vancouver so far this year.
Still, with resale home sales averaging more than 4,000 per month and 50% of new-multi-family strata projects selling out – a pace of around 2,800 per month – supply is barely keeping pace with demand. In fact, the number of active listings in June were down 1% from a month earlier and new listings down 18% compared to May.
The number of Metro Vancouver properties sold in the first six months of the year is the second highest on record, just below the first half of 2016. Without a substantial supply in homes available, that demand continues to create pressure on prices.
The revised mortgage “stress test” rules came into place June 1, but with multiple offers still significantly occurring below $1 million, the effects of this change don’t seem to have had much effect. Demand is strong at the lower price levels and the continued lack of homes available for sale will continue to create an extremely competitive landscape.
And remember, you only have to qualify for the stress test 5.25% mortgage rate, not pay it.
Right now, it is possible to secure a five-year variable mortgage at 0.99%, perhaps the lowest rate in Canadian history.
• Highest detached house price increase from May: West Vancouver, up 3.4%
• Highest condominium price increase from May: Maple Ridge, up 3%
• Biggest decrease in detached house sales from May: Surrey, down 29.8%
• Lowest price detached houses in June: Sunshine Coast, at $838,300
• Highest price detached house in June: Vancouver’s West Side, at $3.38 million
• Top small market for investors to watch: Ladner
Vancouver Westside: Total West Side housing sales in June, at 616 transactions, were down 16% from May, but 51% higher than in June 2020. New Listings in June were down 13% compared to May 2021, yet up 10% compared to June 2020. The result is a 48% sales-to-new-listing ratio, and a subsequent price increase. In June the benchmark West Side detached house price, for example, was $3,458,300, up 16.3% from a year earlier and 2.2% higher – that is $76,000 – than a month earlier. The total current inventory of residential listings is steady at a four month’s supply, signaling a continued seller’s market. Condo investors should note that West Side apartment prices have not budged much in two months and are now less expensive, at $831,200, than they were three years ago, while average rents have increased.
Vancouver East Side: The East Side of Vancouver continues as a hot market, with June sales up 5% from May, to 451, a 61% increase from June 2020. New listings dropped to just 1,071 homes, down 17% from a year ago. The composite benchmark home price was down 0.2% from May and the detached house price fell 0.8%,month-over-month to $1,695,500. There is now a 3-month supply of listings on the East Side market and the sales-to-listing ratio is 66%, one of the strongest levels in Metro Vancouver. With prices moderating this summer despite the healthy sales, buyers may want to take advantage.
North Vancouver: North Vancouver saw listings of homes for sale drop 21% in June from a month earlier. June sale transactions fell 10% from May, to 322, and composite benchmark prices was up just 0.6 per cent from a month earlier, to $1,123,800, with detached houses also virtually unchanged at $1,914,000. On the resale market, there is about a 2-month supply of homes for sale, and the sales to listing ratio is 70%, signalling a seller’s market. There are 33 new condo projects and 25 townhouse developments underway across North Vancouver City and District, so future supply, albeit more expensive, is coming.
West Vancouver: West Vancouver is primarily a detached house market, so city proposals that would reduce the size of new houses and at the same time allow coach houses and secondary suites are worth watching. Plans call for the floor-space ratio on large lots reduced from 0.35 to 0.30, with a maximum of 2,200 square feet of house allowed on smaller lots. However, the city is also considering allowing an 800-square foot ‘bonus’ for a separate coach house (or laneway house) and 500 square feet for a secondary suite. The bonus would also be applied on lots with homes built prior to 1976, provided that the original house is retained. The new rules, if all approved, would come in January of 2022. Meanwhile, there was little change in West Vancouver’s housing market in June: sales were down 1% from May and active listings dropped by just 7 homes from a month earlier. West Vancouver’s detached house price is now $3,152,500, up just 0.4% from May, but 21.5% higher than in June 2020.
Richmond: You may not notice because of the construction dust coming from 1,000 new multi-family homes being built at the Richmond Centre shopping centre site, but Richmond housing sales dipped 7% in June from a month earlier, to 472 transactions, and new listings were down 15%, month-over-month. The sales-to-listing ratio is a healthy 66%, however, which keeps this a seller’s market. Richmond is considered a major destination for foreign buyers and new immigrants so the expected opening of international borders by this September is reason for confidence for home sellers and developers. The June detached house price in Richmond was unchanged from May at $1,910,500, but up almost 20% from a year earlier.
Ladner: A game-changing decision is expected “shortly”, 16 months after the federal government said funding is available for either an eight-lane new tunnel or an eight-lane bridge to replace the aging Massey Tunnel. When approved the decision could have a profound effect on Ladner property values. Ladner is a small market – just 52 home sales and 100 active listings in June – but developers and the local council apparently have big plans for the waterfront community. Buyers do too. In June, Ladner’s sales-to-listing ratio was 98%. I humbly suggest that Ladner may the prime sleeper market in Metro Vancouver.
Tsawwassen: Total June housing sales in Tsawwassen reached 70, down 26% from May but up 100% from June of last year. Active Listings were 185, compared to 270 at that time in 2020, and 182 at the end of May; New listings in June were down 22% compared to May 2021 and down 14% compared to June 2020. This remains a strong seller’s market, with a sales-to-listings ratio of 70% compared to 74% in May.
Burnaby East: Burnaby East, like many areas, saw housing sales decline in June, dropping 8% from May to just 49 total sales. What is different here is that the sales-to-listing ratio is a scorching 89%, as new listings dropped nearly 30%. There is only a 2-month supply of homes for sale if the current trends continue. The benchmark house price in East Burnaby is now $1,440,000, down 2% from May, the biggest month-over-month drop and the lowest house price in Burnaby.
Burnaby North: The next phase of what will be 13 new residential towers at the Amazing Burnaby site in North Burnaby goes to public hearing June 29, so this area will apparently continue to see a good supply of strata product. This is welcomed because new listings of existing homes for sale fell 21% in June compared to May and there was only 519 active listings in June compared to 215 sales. The sales-to-listing ratio is 70% so there is no shortage of demand in what is a strong seller’s market.
Burnaby South: Townhouse buyers looking for value should consider South Burnaby, which borders three municipalities and has lower townhouse prices than any of them. In June, the typical South Burnaby townhouse sold for $702,200. This is $300,000 less than in East Vancouver; $223,000 less than in Richmond; and $120,000 below the benchmark price in New Westminster. Also, Burnaby South townhouse prices are up just 8% from a year ago, compared to double-digit increases in its three neighbouring municipalities. Burnaby South also has Burnaby’s lowest priced detached houses and condo apartments. This may help explain why Burnaby South total home sales posted the smallest sales decline of all Burnaby markets in June, down 6% from May.
New Westminster: The Royal City is becoming a condo market, seen in the tower construction on the Quay and the sales performance so for this year, which has seen 702 condo apartments sell, up from 340 at the same time last year. Of the 154 total residential sales in June in New Westminster, 106 were condos, which sold for a median price of less than $550,000, the second-lowest price in Greater Vancouver. A key reason is that younger buyers have embraced New West. A recent national survey ranked New Westminster as the No. 1 B.C. city for Millennial home buyers. There is only a 2-month supply of all types of homes in New Westminster, however, as 61 per cent of listings sold in June. If you want to get into the New West action, you may want to get moving.
Coquitlam: Coquitlam, where the mayor is the former president of the B.C. homebuilders association, is doing a lot of little things right and big things brilliantly. Coquitlam was an early adapter of smaller lots and laneway houses.
Its giant Burke Mountain residential community is a huge success, its multi-faceted development at SkyTrain-linked Coquitlam Centre is forging ahead with major partners and now the city has plans for a rural-type subdivision in its Hazel-Coy area along the Coquitlam River. Details to be announced later this year, but plans call for 950 new homes over 100 acres. Coquitlam home sales were 329 in June, up 52% from June 2020, even though active listings were down 12% in the same period. The sales-to-listing ratio is 72%, an indication that many buyers are eager to buy into Coquitlam’s vision.
Port Moody: Port Moody appears to have more interest in approving rental apartments than strata projects, but the condos being developed are increasingly sophisticated: one will boast a waterfall, another a day care; another with Inlet views from a rooftop patio. Most Port Moody condos are fairly new, dating to just before and after the arrival of SkyTrain. This explains the current median condo price of $680,000, the highest in the Tri-Cities. Still, 263 condos have sold in the city in the past six months, more than double the number in the first half of 2020. The entire housing market is solid, with sales of 95 units in June, up 50% from June 2020, and a sales-to-listing ratio of 62%.
Port Coquitlam: The biggest residential development planned for Port Coquitlam is social housing, but buyers can also find comfort here, with median condo prices at under $500,000 and both detached houses and townhouse prices the lowest in the Tri-Cities. Comfort is appealing: the sales to listing ratio in June was 84%, the highest in the Tri-Cities and among the top in Greater Vancouver. Port Coquitlam is in close proximity to the giant Coquitlam Centre development, but at lower cost.
Pitt Meadows: Like many more rural markets, Pitt Meadow saw a sharp drop in total residential sales in June, with transactions dropping 19% from May to just 44 units. New Listings in June were down 6% compared to May 2021. Month’s supply of total residential listings is steady at 1-month’s supply, but the strong sellers’ market is a bit muted, with 73% of new listings selling in June, down from 84% in May.
Maple Ridge: Affordable, growing Maple Ridge saw 244 home sales in June, down 15% from May but 85% higher than in June 2020. The benchmark composite home price is $996,800, up 27.5% from year ago, but virtually unchanged from May at among the lowest in Greater Vancouver. Condo prices dipped 0.4% from May to $428,400 in June, the lowest in the entire region. Seller’s market conditions continue, with a sales-to-listing ratio at a startling 89% in June. With just 383 active listings on the market, prices will likely increase this summer.
Surrey: The second-largest city in the Lower Mainland saw price increases cooling in June, with average house prices, which had soared 27% from a year earlier, eking out a 0.5% increase from May to $1,511,707 in June. Sales of detached houses plunged 29.8% from May, to 421, however, an indication that the cooling may become a chill. Townhouse transactions, down 19.5% month-over-month, and condo apartment sales, down 25.3% from May, followed the downward trend. The average Surrey townhouse price in June was $747,256, while the average condo sold for $468,319, with both prices down fractionally from May.

FOR IMMEDIATE RELEASE:
Home sale and listing activity in Metro Vancouver moves off of its record-breaking pace
VANCOUVER, BC – June 2, 2021 – The Metro Vancouver* housing market saw steady home sale and listing activity in May, a shift back from the record-breaking activity seen in the earlier spring months.
The Real Estate Board of Greater Vancouver (REBGV) reports that residential home sales in the region totalled 4,268 in May 2021, a 187.4 per cent increase from the 1,485 sales recorded in May 2020, and a 13 per cent decrease from the 4,908 homes sold in April 2021.
Last month’s sales were 27.7 per cent above the 10-year May sales average.
“While home sale and listing activity remained above our long-term averages in May, conditions moved back from the record-setting pace experienced throughout Metro Vancouver in March and April of this year,” Keith Stewart, REBGV economist said. “With a little less intensity in the market today than we saw earlier in the spring, home sellers need to ensure they’re working with their REALTOR® to price their homes based on current market conditions.”
There were 7,125 detached, attached and apartment properties newly listed for sale on the Multiple Listing Service® (MLS®) in Metro Vancouver in May 2021. This represents a 93.4 per cent increase compared to the 3,684 homes listed in May 2020 and a 10.2 per cent decrease compared to April 2021 when 7,938 homes were listed.
The total number of homes currently listed for sale on the MLS® system in Metro Vancouver is 10,970, a 10.5 per cent increase compared to May 2020 (9,927) and a 7.1 per cent increase compared to April 2021 (10,245).
"With sales easing down from record peaks, a revised mortgage stress test that reduces the maximum borrowing amounts by approximately 4.5 per cent, and the average five-year fixed mortgage rate climbing back over two per cent since the beginning of 2021, we’ll pay close attention to these factors leading into the summer to understand what affect they’ll have on the current market cycle,” Stewart said.
For all property types, the sales-to-active listings ratio for May 2021 is 38.9 per cent. By property type, the ratio is 29.8 per cent for detached homes, 53.8 per cent for townhomes, and 43.5 per cent for apartments.
Generally, analysts say downward pressure on home prices occurs when the ratio dips below 12 per cent for a sustained period, while home prices often experience upward pressure when it surpasses 20 per cent over several months.
“The seller’s market conditions experienced throughout much of the pandemic highlight the need for increasing the volume and variety of housing supply across our region,” Stewart said. “Doing this requires a more disciplined focus on planning, reducing building costs, understanding demographic changes, and expediting the building approval process.”
The MLS® Home Price Index1 composite benchmark price for all residential properties in Metro Vancouver is currently $1,172,800. This represents a 14 per cent increase over May 2020 and a 1.5 per cent increase compared to April 2021.
Sales of detached homes in May 2021 reached 1,430, a 166 per cent increase from the 537 detached sales recorded in May 2020. The benchmark price for a detached home is $1,800,600. This represents a 22.8 per cent increase from May 2020 and a 1.7 per cent increase compared to April 2021.
Sales of apartment homes reached 2,049 in May 2021, a 213 per cent increase compared to the 653 sales in May 2020. The benchmark price of an apartment home is $737,100. This represents a 7.9 per cent increase from May 2020 and a 1.2 per cent increase compared to April 2021.
Attached home sales in May 2021 totalled 800, a 168 per cent increase compared to the 298 sales in May 2020. The benchmark price of an attached home is $936,300. This represents a 16.3 per cent increase from May 2020 and a 1.8 per cent increase compared to April 2021.
*Editor’s Note: Areas covered by the Real Estate Board of Greater Vancouver include: Burnaby, Coquitlam, Maple Ridge, New Westminster, North Vancouver, Pitt Meadows, Port Coquitlam, Port Moody, Richmond, South Delta, Squamish, Sunshine Coast, Vancouver, West Vancouver, and Whistler.
MLS® Home Price Index 2021 update
1.) The national MLS® Home Price Index (MLS® HPI) operations group underwent an annual review of the model in May. In line with best statistical practices, the MLS® HPI is reviewed annually.
MLS® HPI coverage was extended to neighbourhoods where sales volumes picked up enough to support benchmark price tracking and was discontinued for neighbourhoods where sales became too sparse to support benchmark price calculations.
To ensure the MLS® HPI coverage is consistent and comparable, historical aggregate and composite data has been recalculated based on revised and consistent coverage.
The real estate industry is a key economic driver in British Columbia. In 2020, 30,944 homes changed ownership in the Board’s area, generating $2.1 billion in economic spin-off activity and an estimated 14,728 jobs. The total dollar value of residential sales transacted through the MLS® system in Greater Vancouver totalled $33.7 billion in 2020.
The Real Estate Board of Greater Vancouver is an association representing more than 14,000 REALTORS® and their companies. The Board provides a variety of member services, including the Multiple Listing Service®. For more information on real estate, statistics, and buying or selling a home, contact a local REALTOR® or visit www.rebgv.org.
It was a banner April for sales in Greater Vancouver. Have a look at the stats from The Real Estate Board of Greater Vancouver:
|
Home buyer demand remains elevated across Metro Vancouver
In the first month of 2021, Metro Vancouver’s* housing market continued the pattern set at the end of last year with home sale activity outpacing the supply of homes listed for sale.
The Real Estate Board of Greater Vancouver (REBGV) reports that residential home sales in the region totalled 2,389 in January 2021, a 52.1 per cent increase from the 1,571 sales recorded in January 2020, and a 22.8 per cent decrease from the 3,093 homes sold in December 2020.
Last month’s sales were 36.4 per cent above the 10-year January sales average.
“With home sale activity well above our January average, the supply of homes for sale isn’t able to keep pace,” Colette Gerber, REBGV Chair said. “This is causing increased competition amongst home buyers and upward pressure on prices.”
There were 4,480 detached, attached and apartment properties newly listed for sale on the Multiple Listing Service® (MLS®) in Metro Vancouver in January 2021. This represents a 15.7 per cent increase compared to the 3,872 homes listed in January 2020 and an 86 per cent increase compared to December 2020 when 2,409 homes were listed.
The total number of homes currently listed for sale on the MLS® system in Metro Vancouver is 8,306, a 3.6 per cent decrease compared to January 2020 (8,617) and a 2.7 per cent decrease compared to December 2020 (8,538).
For all property types, the sales-to-active listings ratio for January 2021 is 28.8 per cent. By property type, the ratio is 26.3 per cent for detached homes, 37.6 per cent for townhomes, and 27.8 per cent for apartments.
Generally, analysts say downward pressure on home prices occurs when the ratio dips below 12 per cent for a sustained period, while home prices often experience upward pressure when it surpasses 20 per cent over several months.
“Shifting housing needs during the pandemic and historically low interest rates have been key drivers of demand in our market over the last six months,” Gerber said. “People who managed to enter the market a few years ago, and have seen their home values increase, are now looking to move up in the market to accommodate their changing needs.”
The MLS® Home Price Index composite benchmark price for all residential properties in Metro Vancouver is currently $1,056,600. This represents a 5.5 per cent increase compared to January 2020 and a 0.9 per cent increase compared to December 2020.
Sales of detached homes in January 2021 reached 740, a 68.6 per cent increase from the 439 detached sales recorded in January 2020. The benchmark price of a detached homes is $1,576,800. This represents a 10.8 per cent increase from January 2020 and a 1.4 per cent increase compared to December 2020.
Sales of apartment homes reached 1,195 in January 2021, a 46.8 per cent increase compared to the 814 sales in January 2020. The benchmark price of an apartment home is $680,800. This represents a 2.2 per cent increase from January 2020 and a 0.6 per cent increase compared to December 2020.
Attached home sales in January 2021 totalled 454, a 42.8 per cent increase compared to the 318 sales in January 2020. The benchmark price of an attached home is $815,800. This represents a 4.3 per cent increase from January 2020 and a 0.2 per cent increase compared to December 2020.
The real estate market in Greater Vancouver has really outperformed this year despite the pandemic. For example the West Side inventory of single family homes has shimmied down from 15 months of supply in January to 6 months supply in December with sales volume up about 18% year over year. We've had 889 West Side single family homes sell so far this year as compared with 752 last year, while supply is significantly lower this year. This is good news after over two years of slump. As the supply has diminished the benchmark prices have risen slightly.
Have a look at the numbers for detached, townhome and apartment properties in the Greater Vancouver regions:
december 14 2020 sales and listing stats
SEVEN DAYS UNTIL CHRISTMAS

Here is why we have such a competitive real estate market in a nutshell. The weekly listing count is neck in neck with the weekly sales count leaving a shortage of inventory to choose from. This is happening while we have virtually no foreign Buyers in the market so there goes that line of thinking as to who to blame for our high housing prices.
REBGV Chair Colette Gerber provides a summary of the October 2020 housing market statistics.
Home sale and listing resurgence extends into the fall
Home sale and new listing activity remained at near record levels across Metro Vancouver in October.
The Real Estate Board of Greater Vancouver (REBGV) reports that residential home sales in the region totalled 3,687 in October 2020, a 29 per cent increase from the 2,858 sales recorded in October 2019, and a 1.2 per cent increase from the 3,643 homes sold in September 2020.
Last month’s sales were 34.7 per cent above the 10-year October sales average and stands as the second-highest total on record for the month.
“Home has been a focus for residents during the pandemic. With more days and evenings spent at home this year, people are re-thinking their housing situation," Colette Gerber, REBGV Chair said. “Throughout this period, REALTORS® have been working to understand and adapt to the latest safety protocols so that they can continue to help the public meet their housing needs in a safe and responsible way.”
There were 5,571 detached, attached and apartment homes newly listed for sale on the Multiple Listing Service® (MLS®) in Metro Vancouver in October 2020. This represents a 36.7 per cent increase compared to the 4,074 homes listed in October 2019 and a 13 per cent decrease compared to September 2020 when 6,402 homes were listed.
The total number of homes currently listed for sale on the MLS® system in Metro Vancouver is 12,416, a 1.5 per cent increase compared to October 2019 (12,236) and a 5.2 per cent decrease compared to September 2020 (13,096).
“With demand on the rise, homes priced right for today’s market are receiving attention and, at times, garnering multiple offers," Gerber said. "To understand the market conditions in your neighbourhood and property type of choice, work with your local REALTOR® to assess the latest MLS® housing market information."
For all property types, the sales-to-active listings ratio for October 2020 is 29.7 per cent. By property type, the ratio is 30.9 per cent for detached homes, 43.5 per cent for townhomes, and 24.9 per cent for apartments.
Generally, analysts say downward pressure on home prices occurs when the ratio dips below 12 per cent for a sustained period, while home prices often experience upward pressure when it surpasses 20 per cent over several months.
The MLS® Home Price Index composite benchmark price for all residential properties in Metro Vancouver is currently $1,045,100. This represents a six per cent increase over October 2019 and a 0.4 per cent increase compared to September 2020.
Sales of detached homes in October 2020 reached 1,335, a 42.3 per cent increase from the 938 detached sales recorded in October 2019. The benchmark price for a detached home is $1,523,800. This represents an 8.5 per cent increase from October 2019 and a 1.1 per cent increase compared to September 2020.
Sales of apartment homes reached 1,570 in October 2020, a 13.4 per cent increase compared to the 1,384 sales in October 2019. The benchmark price of an apartment property is $683,500. This represents a 4.4 per cent increase from October 2019 and is unchanged compared to September 2020.
Attached home sales in October 2020 totalled 782, a 45.9 per cent increase compared to the 536 sales in October 2019. The benchmark price of an attached home is $813,000. This represents a 5.4 per cent increase from October 2019 and a 0.4 per cent increase compared to September 2020.
News Release
FOR IMMEDIATE RELEASE:
Metro Vancouver home sales and listings surge in September VANCOUVER, BC – October 2, 2020 – Home sale and new listing activity reached record
levels in Metro Vancouver* in September.
The Real Estate Board of Greater Vancouver (REBGV) reports that residential home sales in the region totalled 3,643 in September 2020, a 56.2 per cent increase from the 2,333 sales recorded in September 2019, and a 19.6 per cent increase from the 3,047 homes sold in August 2020.
Last month’s sales were 44.8 per cent above the 10-year September sales average and is the highest total on record for the month.
“We've seen robust home sale and listing activity across Metro Vancouver throughout the summer months," Colette Gerber, REBGV Chair said. "This increased activity can be attributed, in part, to lower interest rates and changing housing needs during the COVID-19 pandemic."
There were 6,402 detached, attached and apartment properties newly listed for sale on the Multiple Listing Service® (MLS®) in Metro Vancouver in September 2020. This represents a 31.6 per cent increase compared to the 4,866 homes listed in September 2019 and a 10.1 per cent increase compared to August 2020 when 5,813 homes were listed.
The total number of homes currently listed for sale on the MLS® system in Metro Vancouver is 13,096, a 2.6 per cent decrease compared to September 2019 (13,439) and a 2.3 per cent increase compared to August 2020 (12,803).
"While the pace of new MLS® listings entering the market is increasing, the heightened demand from home buyers is keeping overall supply levels down," Gerber said. "This is creating upward pressure on home prices, which have been edging up since the spring."
For all property types, the sales-to-active listings ratio for September 2020 is 27.8 per cent. By property type, the ratio is 28.3 per cent for detached homes, 36.1 per cent for townhomes, and 24.8 per cent for apartments.
Generally, analysts say downward pressure on home prices occurs when the ratio dips below 12 per cent for a sustained period, while home prices often experience upward pressure when it surpasses 20 per cent over several months.
The MLS® Home Price Index composite benchmark price for all residential properties in Metro Vancouver is currently $1,041,300. This represents a 5.8 per cent increase over September 2019, and a 0.3 per cent increase compared to August 2020.
Sales of detached homes in September 2020 reached 1,317, a 76.8 per cent increase from the 745 detached sales recorded in September 2019. The benchmark price for detached properties is $1,507,500. This represents a 7.8 per cent increase from September 2019 and a 1.1 per cent increase compared to August 2020.
Sales of apartment homes reached 1,596 in September 2020, a 36.9 per cent increase compared to the 1,166 sales in September 2019. The benchmark price of an apartment property is $683,500. This represents a 4.5 per cent increase from September 2019 and a 0.3 per cent decrease compared to August 2020.
Attached home sales in September 2020 totalled 730, a 73 per cent increase compared to the 422 sales in September 2019. The benchmark price of an attached unit is $809,900. This represents a 5.2 per cent increase from September 2019 and a 0.4 per cent increase compared to August 2020.
*Editor’s Note: Areas covered by the Real Estate Board of Greater Vancouver include: Burnaby, Coquitlam, Maple Ridge, New Westminster, North Vancouver, Pitt Meadows, Port Coquitlam, Port Moody, Richmond, South Delta, Squamish, Sunshine Coast, Vancouver, West Vancouver, and Whistler.

Home sale and new listing activity reached record levels in Metro Vancouver in September.
The Real Estate Board of Greater Vancouver (REBGV) reports that residential home sales in the region totalled 3,643 in September 2020, a 56.2 per cent increase from the 2,333 sales recorded in September 2019, and a 19.6 per cent increase from the 3,047 homes sold in August 2020.
Last month’s sales were 44.8 per cent above the 10-year September sales average and is the highest total on record for the month.
“We've seen robust home sale and listing activity across Metro Vancouver throughout the summer months," Colette Gerber, REBGV Chair said. "This increased activity can be attributed, in part, to lower interest rates and changing housing needs during the COVID-19 pandemic."
There were 6,402 detached, attached and apartment properties newly listed for sale on the Multiple Listing Service® (MLS®) in Metro Vancouver in September 2020. This represents a 31.6 per cent increase compared to the 4,866 homes listed in September 2019 and a 10.1 per cent increase compared to August 2020 when 5,813 homes were listed.
The total number of homes currently listed for sale on the MLS® system in Metro Vancouver is 13,096, a 2.6 per cent decrease compared to September 2019 (13,439) and a 2.3 per cent increase compared to August 2020 (12,803).
"While the pace of new MLS® listings entering the market is increasing, the heightened demand from home buyers is keeping overall supply levels down," Gerber said. "This is creating upward pressure on home prices, which have been edging up since the spring."
For all property types, the sales-to-active listings ratio for September 2020 is 27.8 per cent. By property type, the ratio is 28.3 per cent for detached homes, 36.1 per cent for townhomes, and 24.8 per cent for apartments.
Generally, analysts say downward pressure on home prices occurs when the ratio dips below 12 per cent for a sustained period, while home prices often experience upward pressure when it surpasses 20 per cent over several months.
The MLS® Home Price Index composite benchmark price for all residential properties in Metro Vancouver is currently $1,041,300. This represents a 5.8 per cent increase over September 2019, and a 0.3 per cent increase compared to August 2020.
Sales of detached homes in September 2020 reached 1,317, a 76.8 per cent increase from the 745 detached sales recorded in September 2019. The benchmark price for detached properties is $1,507,500. This represents a 7.8 per cent increase from September 2019 and a 1.1 per cent increase compared to August 2020.
Sales of apartment homes reached 1,596 in September 2020, a 36.9 per cent increase compared to the 1,166 sales in September 2019. The benchmark price of an apartment property is $683,500. This represents a 4.5 per cent increase from September 2019 and a 0.3 per cent decrease compared to August 2020.
Attached home sales in September 2020 totalled 730, a 73 per cent increase compared to the 422 sales in September 2019. The benchmark price of an attached unit is $809,900. This represents a 5.2 per cent increase from September 2019 and a 0.4 per cent increase compared to August 2020.
Areas covered by the Real Estate Board of Greater Vancouver include: Burnaby, Coquitlam, Maple Ridge, New Westminster, North Vancouver, Pitt Meadows, Port Coquitlam, Port Moody, Richmond, South Delta, Squamish, Sunshine Coast, Vancouver, West Vancouver, and Whistler.
Want to see out full stats package? Click here: sales and listings statistics for greater vancouver houses townhouses and condos
Home buyer activity increases in October VANCOUVER, BC – November 4, 2019 – The Metro Vancouver* housing market is experiencing a fall pickup in home sale activity.
Click here for details from Real Estate Board of Greater Vancouver
Click here for october dexter stats
Increased demand helps housing market reach balanced territoryHome buyer demand has returned to more historically typical levels in Metro Vancouver over the last three months.
The Real Estate Board of Greater Vancouver (REBGV) reports that residential home sales in the region totalled 2,333 in September 2019, a 46.3 per cent increase from the 1,595 sales recorded in September 2018, and a 4.6 per cent increase from the 2,231 homes sold in August 2019.
Last month’s sales were 1.7 per cent below the 10-year September sales average.
“We’re seeing more balanced housing market conditions over the last three months compared to what we saw at this time last year,” Ashley Smith, REBGV president said. “Home buyers are more willing to make offers today, particularly in the townhome and apartment markets.”
There were 4,866 detached, attached and apartment properties newly listed for sale on the Multiple Listing Service® (MLS®) in Metro Vancouver in September 2019. This represents a 7.8 per cent decrease compared to the 5,279 homes listed in September 2018 and a 29.9 per cent increase compared to August 2019 when 3,747 homes were listed.
The total number of homes currently listed for sale on the MLS® system in Metro Vancouver is 13,439, a 2.7 per cent increase compared to September 2018 (13,084) and a 0.3 per cent increase compared to August 2019 (13,396).
For all property types, the sales-to-active listings ratio for September 2019 is 17.4 per cent. By property type, the ratio is 12.7 per cent for detached homes, 18.9 per cent for townhomes, and 21.9 per cent for apartments.
Generally, analysts say that downward pressure on home prices occurs when the ratio dips below 12 per cent for a sustained period, while home prices often experience upward pressure when it surpasses 20 per cent over several months.
“This is a more comfortable market for people on both sides of a real estate transaction,” said Smith. “Home sale and listing activity were both at typical levels for our region in September.”
The MLS® Home Price Index composite benchmark price for all residential homes in Metro Vancouver is currently $990,600. This represents a 7.3 per cent decrease over September 2018 and a 0.3 per cent decrease compared to August 2019.
Sales of detached homes in September 2019 reached 745, a 46.7 per cent increase from the 508 detached sales recorded in September 2018. The benchmark price for a detached home is $1,406,200. This represents an 8.6 per cent decrease from September 2018 and is virtually unchanged compared to August 2019.
Sales of apartment homes reached 1,166 in September 2019, a 43.6 per cent increase compared to the 812 sales in September 2018. The benchmark price of an apartment property is $651,500. This represents a 6.5 per cent decrease from September 2018 and a 0.4 per cent decrease compared to August 2019.
Attached home sales in September 2019 totalled 422, a 53.5 per cent increase compared to the 275 sales in September 2018. The benchmark price of an attached home is $767,500. This represents a 7.2 per cent decrease from September 2018 and a 0.6 per cent decrease compared to August 2019.
Download the September 2019 stats package |
Stats by housing type and price:
Inventory levels are running about 10% below the 10 year average and as a result in spite of slower than normal sales we are seeing more multiple offers on properties in the past month because pricing has caught up to market reality and there is only a moderate supply.
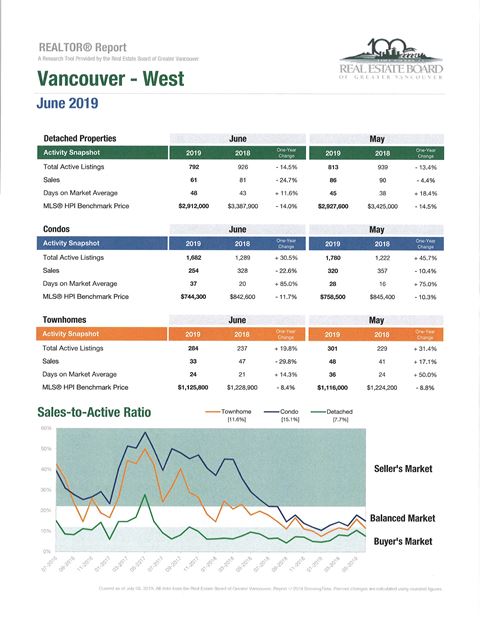
Full Stats Package here
The Metro Vancouver housing market saw increased supply from home sellers and below average demand from home buyers in February.
The Real Estate Board of Greater Vancouver (REBGV) reports that residential home sales in the region totalled 1,484 in February 2019, a 32.8 per cent decrease from the 2,207 sales recorded in February 2018, and a 34.5 per cent increase from the 1,103 homes sold in January 2019.
Last month’s sales were 42.5 per cent below the 10-year February sales average.
“For much of the past four years, we’ve been in a sellers’ market. Conditions have shifted over the last 12 months to favour buyers, particularly in the detached home market,” Phil Moore, REBGV president said. “This means that home buyers face less competition today, have more selection to choose from and more time to make their decisions.”
There were 3,892 detached, attached and apartment properties newly listed for sale on the Multiple Listing Service® (MLS®) in Metro Vancouver in February 2019. This represents a 7.8 per cent decrease compared to the 4,223 homes listed in February 2018 and a 19.7 per cent decrease compared to the 4,848 homes listed in January 2019.
The total number of homes currently listed for sale on the MLS® system in Metro Vancouver is 11,590, a 48.2 per cent increase compared to February 2018 (7,822) and a 7.2 per cent increase compared to January 2019 (10,808).
For all property types, the sales-to-active listings ratio for February 2019 is 12.8 per cent.
Generally, analysts say that downward pressure on home prices occurs when the ratio dips below the 12 per cent mark for a sustained period, while home prices often experience upward pressure when it surpasses 20 per cent over several months.
“Homes priced well for today’s market are attracting interest, however, buyers are choosing to take a wait-and-see approach for the time being,” Moore said. “REALTORS® continue to experience more traffic at open houses. We’ll see if this trend leads to increased sales activity during the spring market.”
The MLS® Home Price Index composite benchmark price for all residential properties in Metro Vancouver is currently $1,016,600. This represents a 6.1 per cent decrease over February 2018, a 6.2 per cent decrease over the past six months, and a 0.3 per cent decrease compared to January 2019.
Sales of detached homes in February 2019 reached 448, a 27.9 per decrease cent from the 621 detached sales recorded in February 2018. The benchmark price for detached properties is $1,443,100. This represents a 9.7 per cent decrease from February 2018, a 7.6 per cent decrease over the past six months, and a 0.7 per cent decrease compared to January 2019.
Sales of apartment homes reached 759 in February 2019, a 35.9 per cent decrease compared to the 1,185 sales in February 2018. The benchmark price of an apartment property is $660,300. This represents a four per cent decrease from February 2018, a 5.1 per cent decrease over the past six months, and a 0.3 per cent increase compared to January 2019.
Attached home sales in February 2019 totalled 277, a 30.9 per cent decrease compared to the 401 sales in February 2018. The benchmark price of an attached unit is $789,300. This represents a 3.3 per cent decrease from February 2018, a 6.7 per cent decrease over the past six months, and a 1.4 per cent decrease compared to January 2019.
Download the February 2019 stats package.
The numbers aren't pretty for Sellers as compared with the past two years, with 24 months of inventory in West Vancouver and East and West Vancouver houses sitting at 13 months inventory. Listingss haven't been increasing drastically however, it is sales that have slowed and with it prices have seen a modest drop which is averaging around 5% overall. Single family West Side homes have seen the greatest price adjustments, down up to 20% from the highs of 2017 in some cases. The bulk of the market where most activity takes place--that is condos and townhomes-- has seen a balancing since June and the result is a return to more normal conditions. Buyers can shop around and write offers with proper due diligence contingencies like home inspection. This is a perfect market for financially qualified first time buyers and move up buyers who can likely get an accepted subject to sale offer accepted.
Below are the statistics for November sales averages. They do not tell the whole story though. For example the West Side condo market under $600,000. actually has only 4 months of supply: 136 active listings and 31 sales in November and half of these listings are priced between $550K and $600K. At the entry level of the market there is still competition but far less than we have seen since 2012. With interest rates likely to rise again in March, saavy buyers will see December and January as an opportunity to buy without competition and below the 10 historical average for activity. Waiting for a bottom is a tricky game. We can't see it until it has passed and the market is on the way up.
sales and listings statistics houses townhouses and apartments for november 2018

The Metro Vancouver* housing market continues to experience reduced demand across all housing types.
The Real Estate Board of Greater Vancouver (REBGV) reports that residential home sales in the region totalled 1,929 in August 2018, a 36.6 per cent decrease from the 3,043 sales recorded in August 2017, and a 6.8 per cent decline compared to July 2018 when 2,070 homes sold.
Last month’s sales were 25.2 per cent below the 10-year August sales average.
“Home buyers have been less active in recent months and we’re beginning to see prices edge down for all housing types as a result,” Phil Moore, REBGVpresident said. “Buyers today have more listings to choose from and face less competition than we’ve seen in our market in recent years.”
There were 3,881 detached, attached and apartment homes newly listed for sale on the Multiple Listing Service® (MLS®) in Metro Vancouver in August 2018. This represents an 8.6 per cent decrease compared to the 4,245 homes listed in August 2017 and an 18.6 per cent decrease compared to July 2018 when 4,770 homes were listed.
The total number of homes currently listed for sale on the MLS® system in Metro Vancouver is 11,824, a 34.3 per cent increase compared to August 2017 (8,807) and a 2.6 per cent decrease compared to July 2018 (12,137).
The sales-to-active listings ratio for August 2018 is 16.3 per cent. By housing type, the ratio is 9.2 per cent for detached homes, 19.4 per cent for townhomes, and 26.6 per cent for apartments.
Generally, analysts say that downward pressure on home prices occurs when the ratio dips below the 12 per cent mark for a sustained period, while home prices often experience upward pressure when it surpasses 20 per cent over several months.
“With fewer buyers active in the market, benchmark prices across all three housing categories have declined for two consecutive months across the region,” Moore said.
The MLS® Home Price Index composite benchmark price for all residential properties in Metro Vancouver is currently $1,083,400. This represents a 4.1 per cent increase over August 2017 and a 1.9 per cent decrease since May 2018.
Sales of detached properties in August 2018 reached 567, a 37.1 per cent decrease from the 901 detached sales recorded in August 2017. The benchmark price for detached properties is $1,561,000. This represents a 3.1 per cent decrease from August 2017 and a 2.8 per cent decrease since May 2018.
Sales of apartment properties reached 1,025 in August 2018, 36.5 per cent decrease compared to the 1,613 sales in August 2017. The benchmark price of an apartment property is $695,500. This represents a 10.3 per cent increase from August 2017 and a 1.6 per cent decrease since May 2018.
Attached property sales in August 2018 totalled 337, a 36.3 per cent decrease compared to the 529 sales in August 2017. The benchmark price of an attached unit is $846,100. This represents a 7.9 per cent increase from August 2017 and a 0.8 per cent decrease since May 2018.
Click here to download the full package.
Sales have slackened and prices are adjusting down. We are very likely approaching one of those rare Vancouver good time to buy cycles which we haven't seen since about 2012
Home buyer demand continues to differ based on housing typeApartment and townhome activity is outpacing the detached home market across Metro Vancouver. This activity helped push total residential sales above the historical average in September. The Real Estate Board of Greater Vancouver (REBGV) reports that residential property sales in the region totalled 2,821 in September 2017, a 25.2 per cent increase from the 2,253 sales recorded in September 2016, and a 7.3 per cent decrease compared to August 2017 when 3,043 homes sold. Last month’s sales were 13.1 per cent above the 10-year September sales average. “Our detached homes market is balanced today, while apartment and townhome sales remain in sellers’ market territory,” Jill Oudil, REBGV president said. “If you’re looking to enter the market, as either a buyer or seller, it’s important to understand these trends and use this information to set realistic expectations.” There were 5,375 detached, attached and apartment properties newly listed for sale on the Multiple Listing Service® (MLS®) in Metro Vancouver in September 2017. This represents a 12 per cent increase compared to the 4,799 homes listed in September 2016 and a 26.6 per cent increase compared to August 2017 when 4,245 homes were listed. The total number of homes currently listed for sale on the MLS® system in Metro Vancouver is 9,466, a 1.2 per cent increase compared to September 2016 (9,354) and a 7.5 per cent increase compared to August 2017 (8,807). “Detached homes made up 30 per cent of all sales in September and represented 62 per cent of all the homes listed for sale on the MLS®,” said Oudil. “This dynamic has slowed the pace of upward pressure that we’ve seen on detached home prices in our market over the last few years.” For all property types, the sales-to-active listings ratio for September 2017 is 29.8 per cent. By property type, the ratio is 14.6 per cent for detached homes, 42.3 per cent for townhomes, and 60.4 per cent for apartments. Generally, analysts say that downward pressure on home prices occurs when the ratio dips below the 12 per cent mark for a sustained period, while home prices often experience upward pressure when it surpasses 20 per cent over several months. The MLS® Home Price Index composite benchmark price for all residential properties in Metro Vancouver is currently $1,037,300. This represents a 10.9 per cent increase over September 2016 and a 0.7 per cent increase compared to August 2017. Sales of detached properties in September 2017 reached 852, a 27.9 per cent increase from the sales recorded in September 2016 (666), a decrease of 33 per cent from September 2015 (1,272), and a decrease of 32.9 per cent from September 2014 (1,270). The benchmark price for detached properties is $1,617,300. This represents a 2.9 per cent increase from September 2016 and a 0.1 per cent increase compared to August 2017. Sales of apartment properties reached 1,451 in September 2017, a 19.1 per cent increase compared from the sales recorded in September 2016 (1,218), a 5.1 per cent decrease from September 2015 (1,529), and a 22.1 per cent increase from September 2014 (1,188). The benchmark price of an apartment property is $635,800. This represents a 21.7 per cent increase from September 2016 and a 1.4 per cent increase compared to August 2017. Attached property sales in September 2017 totalled 518, a 40.4 per cent increase compared to the sales recorded in September 2016 (369), a 4.8 per cent decrease from September 2015 (544), and an 11.6 per cent increase from September 2014 (464). The benchmark price of an attached home is $786,600. This represents a 14.5 per cent increase from September 2016 and a 1.1 per cent increase compared to August 2017. Click here to download the full package. |
Click below for the Real Estate Board of Greater Vancouver's stats for June 2017:
West Side condo listings are down over 17% year over year and as a result of low inventory condo sales are down 20% year over year.
West Side detached listings are up 10% year over year while sales are off by 25% year over year and days on market are up 20%.
West Side town home supply is up over 20% in a year, while sales are off close to 5% and are taking 26% longer to sell than last year.
All types of West Side homes have seen price increases since last year with condos up over 10% on the benchmark price.
click for full stats package
May Stats from Real Estate Board of Greater Vancouver
| |
|---|---|
|
|
|
Demand for condominiums and townhomes continues to drive the Metro Vancouver* housing market.
Residential property sales in the region totalled 3,553 in April 2017, a 25.7 per cent decline compared to April 2016 when 4,781 homes sold and a 0.7 per cent decrease from the 3,579 sales recorded in March 2017.
April sales were 4.8 per cent above the 10-year average for the month.
For the first four months of the year, condominium and townhome sales have comprised a larger percentage of all residential sales on the Multiple Listing Service® (MLS®) in Metro Vancouver. Over this time, they’ve accounted for 68.5 per cent, on average, of all residential sales. This is up 10 per cent from the 58.2 per cent average over the same period last year.
“Our overall market is operating below the record-setting pace from a year ago and is in line with historical spring levels. It’s a different story in our condominium and townhome markets," Jill Oudil, Real Estate Board of Greater Vancouver (REBGV) president said. “Demand has been increasing for months and supply is not keeping pace. This dynamic is causing prices to increase and making multiple offer scenarios the norm.”
New listings for detached, attached and apartment properties in Metro Vancouver totalled 4,907 in April 2017. This represents a decrease of 19.9 per cent compared to the 6,127 units listed in April 2016 and a three per cent increase compared to March 2017 when 4,762 properties were listed.
The total number of residential properties currently listed for sale on the MLS® system in Metro Vancouver is 7,813, a 3.5 per cent increase compared to April 2016 (7,550) and a three per cent increase compared to March 2017 (7,586).
The sales-to-active listings ratio for April 2017 is 45.5 per cent for all property types. This is two per cent below March 2017 and is indicative of a sellers’ market. Generally, analysts say that downward pressure on home prices occurs when the ratio dips below the 12 per cent mark for a sustained period, while home prices often experience upward pressure when it surpasses 20 per cent over several months.
By property type, the sales-to-active listings ratio is 26 per cent for detached homes, 58.2 per cent for townhomes, and 82.2 per cent for condominiums.
“Until more entry level, or ‘missing middle’, homes are available for sale in our market, we’ll likely continue to see prices increase,” Oudil said. “There’s been record building this past year, but much of that inventory isn’t ready to hit the market.”
The MLS® Home Price Index composite benchmark price for all residential properties in Metro Vancouver is currently $941,100. This represents a five per cent increase over the past three months and an 11.4 per cent increase compared to April 2016.
Over the last three months, the benchmark price of condominiums has seen the largest increase in the region at 8.2 per cent, followed by townhomes at 5.3 per cent, and detached homes at 2.8 per cent.
“Home buyers are looking to get into the market and they’re facing fierce competition,” Oudil said. “It’s important to work with your local Realtor to help you navigate today’s marketplace.”
Sales of detached properties in April 2017 reached 1,211, a decrease of 38.8 per cent from the 1,979 detached sales recorded in April 2016. The benchmark price for detached properties is $1,516,500. This represents an 8.1 per cent increase over the last 12 months and a 1.8 per cent increase compared to March 2017.
Sales of apartment, or condominium, properties reached 1,722 in April 2017, a decrease of 18.3 per cent compared to the 2,107 sales in April 2016.The benchmark price of an apartment property is $554,100. This represents a 16.6 per cent increase over the past 12 months and a 3.1 per cent increase compared to March 2017.
Attached, or townhome, property sales in April 2017 totalled 620, a decrease of 10.8 per cent compared to the 695 sales in April 2016. The benchmark price of an attached unit is $701,800. This represents a 15.3 per cent increase over the past 12 months and a 2.4 per cent increase compared to March 2017.
| |
|---|---|
|
|
|
This is the Sales and Listings Report updated to the end of July 2016. The Greater Vancouver real estate market slowed with home sales decreasing by 27 per cent in July compared to June. For some markets like North Vancouver, this is typical in summertime, but it was a trend shared throughout the detached market in Metro Vancouver with some areas seeing a more significant decline. West Vancouver Detached sales were down 41% compared to June 2016 and down 45 per cent to July 2015 and were in fact the lowest monthly sales amount since January 2014. Total Month’s Supply of Listings is up to 10 Months there, with sales down and inventories up. Richmond detached sales were down 29 per cent in July compared to June 2016, and down 46 per cent to July 2015. The Sales to Listings Ratio dropped to 38 per cent, the lowest level since January 2014 and the Month’s Supply of Listings is now at 6 Months. Vancouver West and East Side Detached sales were similarly down and showing 6 and 5 Month’s Supply of Listings respectively.
What does this all mean? The detached market was already showing signs of softening over the last three months! particularly in the highest prices areas. Sales of strata properties have continued apace though with this market still seeing Seller Market conditions with 2 Month’s Supply of Listings even with overall sales in those markets lower in July.
"After several months of record-breaking sales activity, home buyer demand returned to more historically normal levels in July,” Dan Morrison, Real Estate Board of Greater Vancouver president said. "Last month’s sales were 6.5 per cent above the 10-year sales average for the month.” So while the numbers show a decline, they were coming off some significant highs.
Here’s a summary of the numbers:
Greater Vancouver: Total Units Sold in July 2016 was 3,301 – down from 4,502 (27%) in June 2016, down from 4,145 (18%) in July 2015, up from 3,111 (6%) in July 2014; Active Listings are at 9,038 compared to 12,559 at this time last year; New Listings in July 2016 were up 2% compared to July 2015, down 12% from June 2016; Month’s Supply of Total Residential Listings is up to 3 Months (Seller’s Market) and a Sales to Listings Ratio of 61% compared to 77% in July 2015 and 74% in June 2016.
Vancouver Westside Residential: Total Units Sold in July 2016 was 604 – down from 816 (26%) in June 2016, down from 806 (25%) in July 2015, up from 597 (1%) in July 2014; Active Listings are at 1,495 compared to 2,103 at this time last year; New Listings in July 2016 were down 4% compared to July 2015, down 10% from June 2016; Month’s Supply of Total Residential Listings remains at 2 Months (Seller’s Market) and a Sales to Listings Ratio of 59% compared to 76% in July 2015 and 72% in June 2016.
Vancouver Eastside Residential Total Units Sold in July 2016 was 290 – down from 407 (29%) in June 2016, down from 391 (25%) in July 2015, down from 360 (19%) in July 2014; Active Listings are at 800 compared to 838 at this time last year; New Listings in July 2016 were down 10% compared to July 2015, down 9% from June 2016; Month’s Supply of Total Residential Listings is up to 3 Months (Seller’s Market) and a Sales to Listings Ratio of 54% compared to 79% in July 2015 and 69% in June 2016.
North Vancouver Residential: Total Units Sold in July 2016 was 240 – down from 346 (30%) in June 2016, down from 285 (15%) in July 2015, up from 225 (7%) in July 2014; Active Listings are at 399 compared to 592 at this time last year; New Listings in July 2016 were up 20% compared to July 2015, down 17% from June 2016; Month’s Supply of Total Residential Listings is up to 2 Months (Seller’s Market) and a Sales to Listings Ratio of 66% compared to 93% in July 2015 and 79% in June 2016.
West Vancouver Houses: Total Units Sold in July 2016 was 67 – down from 109 (39%) in June 2016, down from 110 (61%) in July 2015, down from 94 (29%) in July 2014; Active Listings are at 514 compared to 620 at this time last year; New Listings in July 2016 were flat compared to July 2015, down 9% from June 2016; Month’s Supply of Total Residential Listings is up to 8 Months (Buyer’s Market) and a Sales to Listings Ratio of 33% compared to 54% in July 2015 and 50% in June 2016.
Richmond Residential: Total Units Sold in July 2016 was 433 – down from 637 (32%) in June 2016, down from 543 (20%) in July 2015, up from 409 (6%) in July 2014; Active Listings are at 1,398 compared to 1,836 at this time last year; New Listings in July 2016 were down 1% compared to July 2015, down 13% from June 2016; Month’s Supply of Total Residential Listings is up to 3 Months (Seller’s Market) and a Sales to Listings Ratio of 57% compared to 71% in July 2015 and 73% in June 2016.
Home buyers continue to compete for homes listed for sale across the Metro Vancouver housing market.
Residential property sales in the region totalled 4,400 in June 2016, an increase of 0.6 per cent from the 4,375 sales recorded in June 2015 and a decrease of 7.7 per cent compared to May 2016 when 4,769 homes sold.
Last month’s sales were 28.1 per cent above the 10-year sales average for the month and rank as the highest selling June on record.
"While we're starting to see more properties coming onto the market in recent months, the imbalance between supply and demand continues to influence market conditions," Dan Morrison REBGV president said.
New listings for detached, attached and apartment properties in Metro Vancouver totalled 5,875 in June 2016. This represents an increase of 1.2 per cent compared to the 5,803 units listed in June 2015 and a 6.6 per cent decrease compared to May 2016 when 6,289 properties were listed.
“Since March, we’ve seen more homes listed for sale in our market than in any other four-month period this decade,” Morrison said.
The total number of properties currently listed for sale on the MLS® system in Metro Vancouver is 7,812, a 35.9 per cent decline compared to June 2015 (12,181) and a 1.1 per cent increase compared to May 2016 (7,726).
The sales-to-active listings ratio for June 2016 is 56.3 per cent. While clearly indicative of a seller’s market, this is the lowest this measure has been since February.
Generally, analysts say that downward pressure on home prices occurs when the ratio dips below the 12 per cent mark, while home prices often experience upward pressure when it reaches the 20 to 22 per cent range in a particular community for a sustained period of time.
The MLS® Home Price Index composite benchmark price for all residential properties in Metro Vancouver is currently $917,800. This represents a 32.1 per cent increase compared to June 2015.
Sales of detached properties in June 2016 reached 1,562, a decrease of 18.6 per cent from the 1,920 detached sales recorded in June 2015. The benchmark price for detached properties increased 38.7 per cent from June 2015 to $1,561,500.
Sales of apartment properties reached 2,108 in June 2016, an increase of 18.8 per cent compared to the 1,774 sales in June 2015.The benchmark price of an apartment property increased 25.3 per cent from June 2015 to $501,100.
Attached property sales in June 2016 totalled 730, an increase of 7.2 per cent compared to the 681 sales in June 2015. The benchmark price of an attached unit increased 28.1 per cent from June 2015 to $656,900.
Compiled by Kevin Skipworth of Dexter Realty
So far there have been 1,660 sales in Greater Vancouver in June. The pace of June sales are down slightly compared to May but still very active compared to previous years. Total Active Listings are at 8,357 (down slightly from 8,393 at the same time in May), down from 12,297 in June 2015 and down from 17,199 in June 2014. What’s noticeable in the market is the pace of the strata market compared to the detached housing market. In most market areas, the sales to listings ratio for detached is below that of the strata market. In Vancouver’s Westside, the Sales to Listings Ratio for Detached is at 48% in June, for Townhouses it is 91% and for Condos 97%. In Vancouver’s Eastside it is 58% for Detached, 77% for Townhouses and 110% for Condos. Supply is still an issue in the market combined with strong demand is having the effect on prices were are seeing in the strata market. North Vancouver is still seeing a very undersupplied and active detached market though, continuing the push on prices there.
Here is a summary of the activity so far:
Greater Vancouver – 1,660 Units Sold so far in June 2016 while total New Listings so far in May are 2,152. Total Active Listings are at 8,357 compared to 13,297 at this time last year. Sales To Listings Ratio is at 77% compared to 76% in May.
Vancouver West – 304 Units Sold so far in June 2016 while total New Listings so far in May are 376. Total Active Listings are at 1,316 compared to 2,304 at this time last year. Sales To Listings Ratio is at 81% compared to 76% in May.
Vancouver East – 152 Units Sold so far in June 2016 while total New Listings so far in May are 197. Total Active Listings are at 706 compared to 930 at this time last year. Sales To Listings Ratio is at 77% compared to 67% in May.
North Vancouver – 117 Units Sold so far in June 2016 while total New Listings so far in May are 163. Total Active Listings are at 394 compared to 704 at this time last year. Sales To Listings Ratio is at 72% compared to 69% in May.
West Vancouver – 41 Units Sold so far in June 2016 while total New Listings so far in May are 76. Total Active Listings are at 452 compared to 630 at this time last year. Sales To Listings Ratio is at 54% compared to 56% in May.
Richmond – 224 Units Sold so far in June 2016 while total New Listings so far in May are 314. Total Active Listings are at 1,298 compared to 1,905 at this time last year. Sales To Listings Ratio is at 71% compared to 67% in May.
March is on pace to hit 5,000 homes sold in Greater Vancouver for the first time ever. It would seem that the trend of more sales and less listings is something the market is not deviating from. With 4,462 properties sold so far in March and the current trend of 300 sales a day, March will likely finish close to 5,200 to 5,300 sales. Total active listings are at 7,954 down from 8,091 last month. Some areas will finish with 1 month’s supply of listings or less while 2 months will be the average. A far cry from two years ago when 6 to 10 months was what was available in the market. Some extreme undersupplied markets include North Vancouver townhouses with 56 sales so far in March with only 36 units available. In Vancouver’s West Side, there have been 87 sales and there are 87 active listings. Vancouver West Side condo inventory is down to 661, from a high of 2,344 in the spring of 2013. Here is a summary of the activity so far:
Greater Vancouver – 4,462 Units Sold so far in March 2016 compared to 4,254 Units Sold in February 2016. Total New Listings so far in March are 5,228 compared to 5,967 in February 2016. Total Active Listings are at 7,954 (13,521 at the same time in March 2015), Sales To Listings Ratio is at 85% compared to 71% in February 2016.
Vancouver West - 844 Units Sold so far in March 2016 compared to 852 Units Sold in February 2016. Total New Listings so far in March are 884 compared to 1,199 in February 2016. Total Active Listings are at 1,303 (2,414 at the same time in March 2015), Sales To Listings Ratio is at 95% compared to 71% in February 2016.
Vancouver East – 392 Units Sold so far in March 2016 compared to 342 Units Sold in February 2016. Total New Listings so far in March are 460 compared to 515 in February 2016. Total Active Listings are at 594 (968 at the same time in March 2015), Sales To Listings Ratio is at 85% compared to 66% in February 2016.
North Vancouver – 348 Units Sold so far in March 2016 compared to 346 Units Sold in February 2016. Total New Listings so far in March are 328 compared to 487 in February 2016. Total Active Listings are at 322 (805 at the same time in March 2015), Sales To Listings Ratio is at 106% compared to 71% in February 2016.
West Vancouver – 155 Units Sold so far in March 2016 compared to 169 Units Sold in February 2016. Total New Listings so far in March are 194 compared to 278 in February 2016. Total Active Listings are at 407 (636 at the same time in March 2015), Sales To Listings Ratio is at 80% compared to 61% in February 2016.
Richmond – 560 Units Sold so far in March 2016 compared to 533 Units Sold in February 2016. Total New Listings so far in March are 784 compared to 759 in February 2016. Total Active Listings are at 1,197 (1,893 at the same time in March 2015), Sales To Listings Ratio is at 71% compared to 70% in February 2016.