

Buyers are taking advantage of the opportunity to move up and buy into the townhouse and detached home market with their price decreases in the last 2 years.
There were 2,584 homes sold of all types in Greater Vancouver in July this year compared with 2,098 homes sold last month, 2,018 sales in July last year and 3,012 homes sold in July 2017. This was 8 per cent below the 10-year average for July (compared with 33 per cent below the 10-year average last year in July). It was still the lowest number of homes sold in July since 2012 at 2,135. 1998 to 2000 saw some of the lowest number of sales in the month of July (1,758 in 2000, 2,217 in 1999 and 1,860 in 1998). Buyers are engaging. There were 841 detached houses sold in July 2019 up 32% from June's 637 sales in Greater Vancouver. We've seen a 10.5 per cent decrease in the benchmark price of these homes year over year. For townhouses there were 473 sales in July 2019 compared to 354 in July 2018 (up 33.6 per cent) with a 9 per cent decrease in the benchmark price year over year; and for condos there were 1,243 sales in July, an increase in sales from 1,079 in July 2018 (up 15.2 per cent) with an 8.8 per cent decrease in the benchmark price year over year.
Active Listings are at 15,037 for month end (up 17 per cent compared to July 2018) and after listing expiries at month’s end, there were only 14,469 active listings to start August. This was a much more significant drop in listings at the end of July than we’ve seen after the through the month of July for the last 10 years. Over the last 25 years the number of new listings in the last 6 months of the year has been 30 to 35 per cent less than the number of new listings in the first half of the year – so expect the active listing count to drop even further. Buyers will need to be decisive to take advantage of buyer market conditions.
Supply of homes in Greater Vancouver saw a decrease in the number of new listings in July compared to last month and July of last year. There were 4,719 new listings during July in Greater Vancouver, down 3 per cent from July last year and down 12 per cent from July 2017 and overall are 6 per cent below the 10-year average for July.
The mix of supply currently has 10,000 active listings priced at $1M are more – leaving less than 4,700 active listings priced below $1M in Greater Vancouver. Looking at 13,576 sales in the first 7 months of 2019, there have been only 347 sales above $3M; 672 sales between $2m to $3M; 3,382 sales between $1M to $2M and 9,018 sales below $1M. The competition is clearly in the least suppled range of homes, yet this is not the focus of policy for all levels of government. The provincial government is intent on focusing policy on the least active segment of the market by trying to control that demand. Which begs the question, how are they making housing more affordable by not focusing on the supply of the lower end of the market?
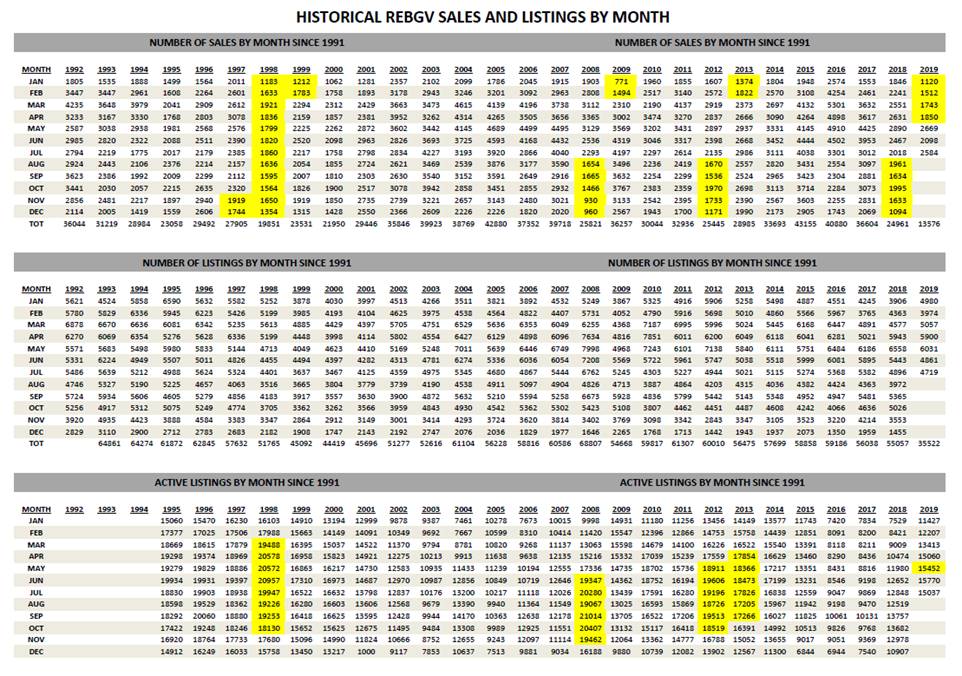
Below is the historical month by month data in Greater Vancouver going back to the early 90’s showing sales, new listings and active listings. The yellow highlighted areas for sales show the slowest months of the market and for active listings, the highest number of active listings we’ve seen in the market. Clearly this latest slowdown in the real estate market saw one of the more prolonged decrease in sales but the least number of active listings for a down market. Sellers are confident and the idea of a significant drop in values won’t happen with that confidence.
See Full Stats Package here: